Analytics
Analytics is a comprehensive API performance monitoring and insights dashboard that helps you analyze API usage patterns and performance metrics across your gateway. It provides aggregated statistics and visualizations to help you understand how your APIs are performing and being used.
Analytics
View detailed analytics and insights for your APIs with aggregated performance metrics.
Accessing
- Navigate to → Analytics
- Select application, environment, and time window
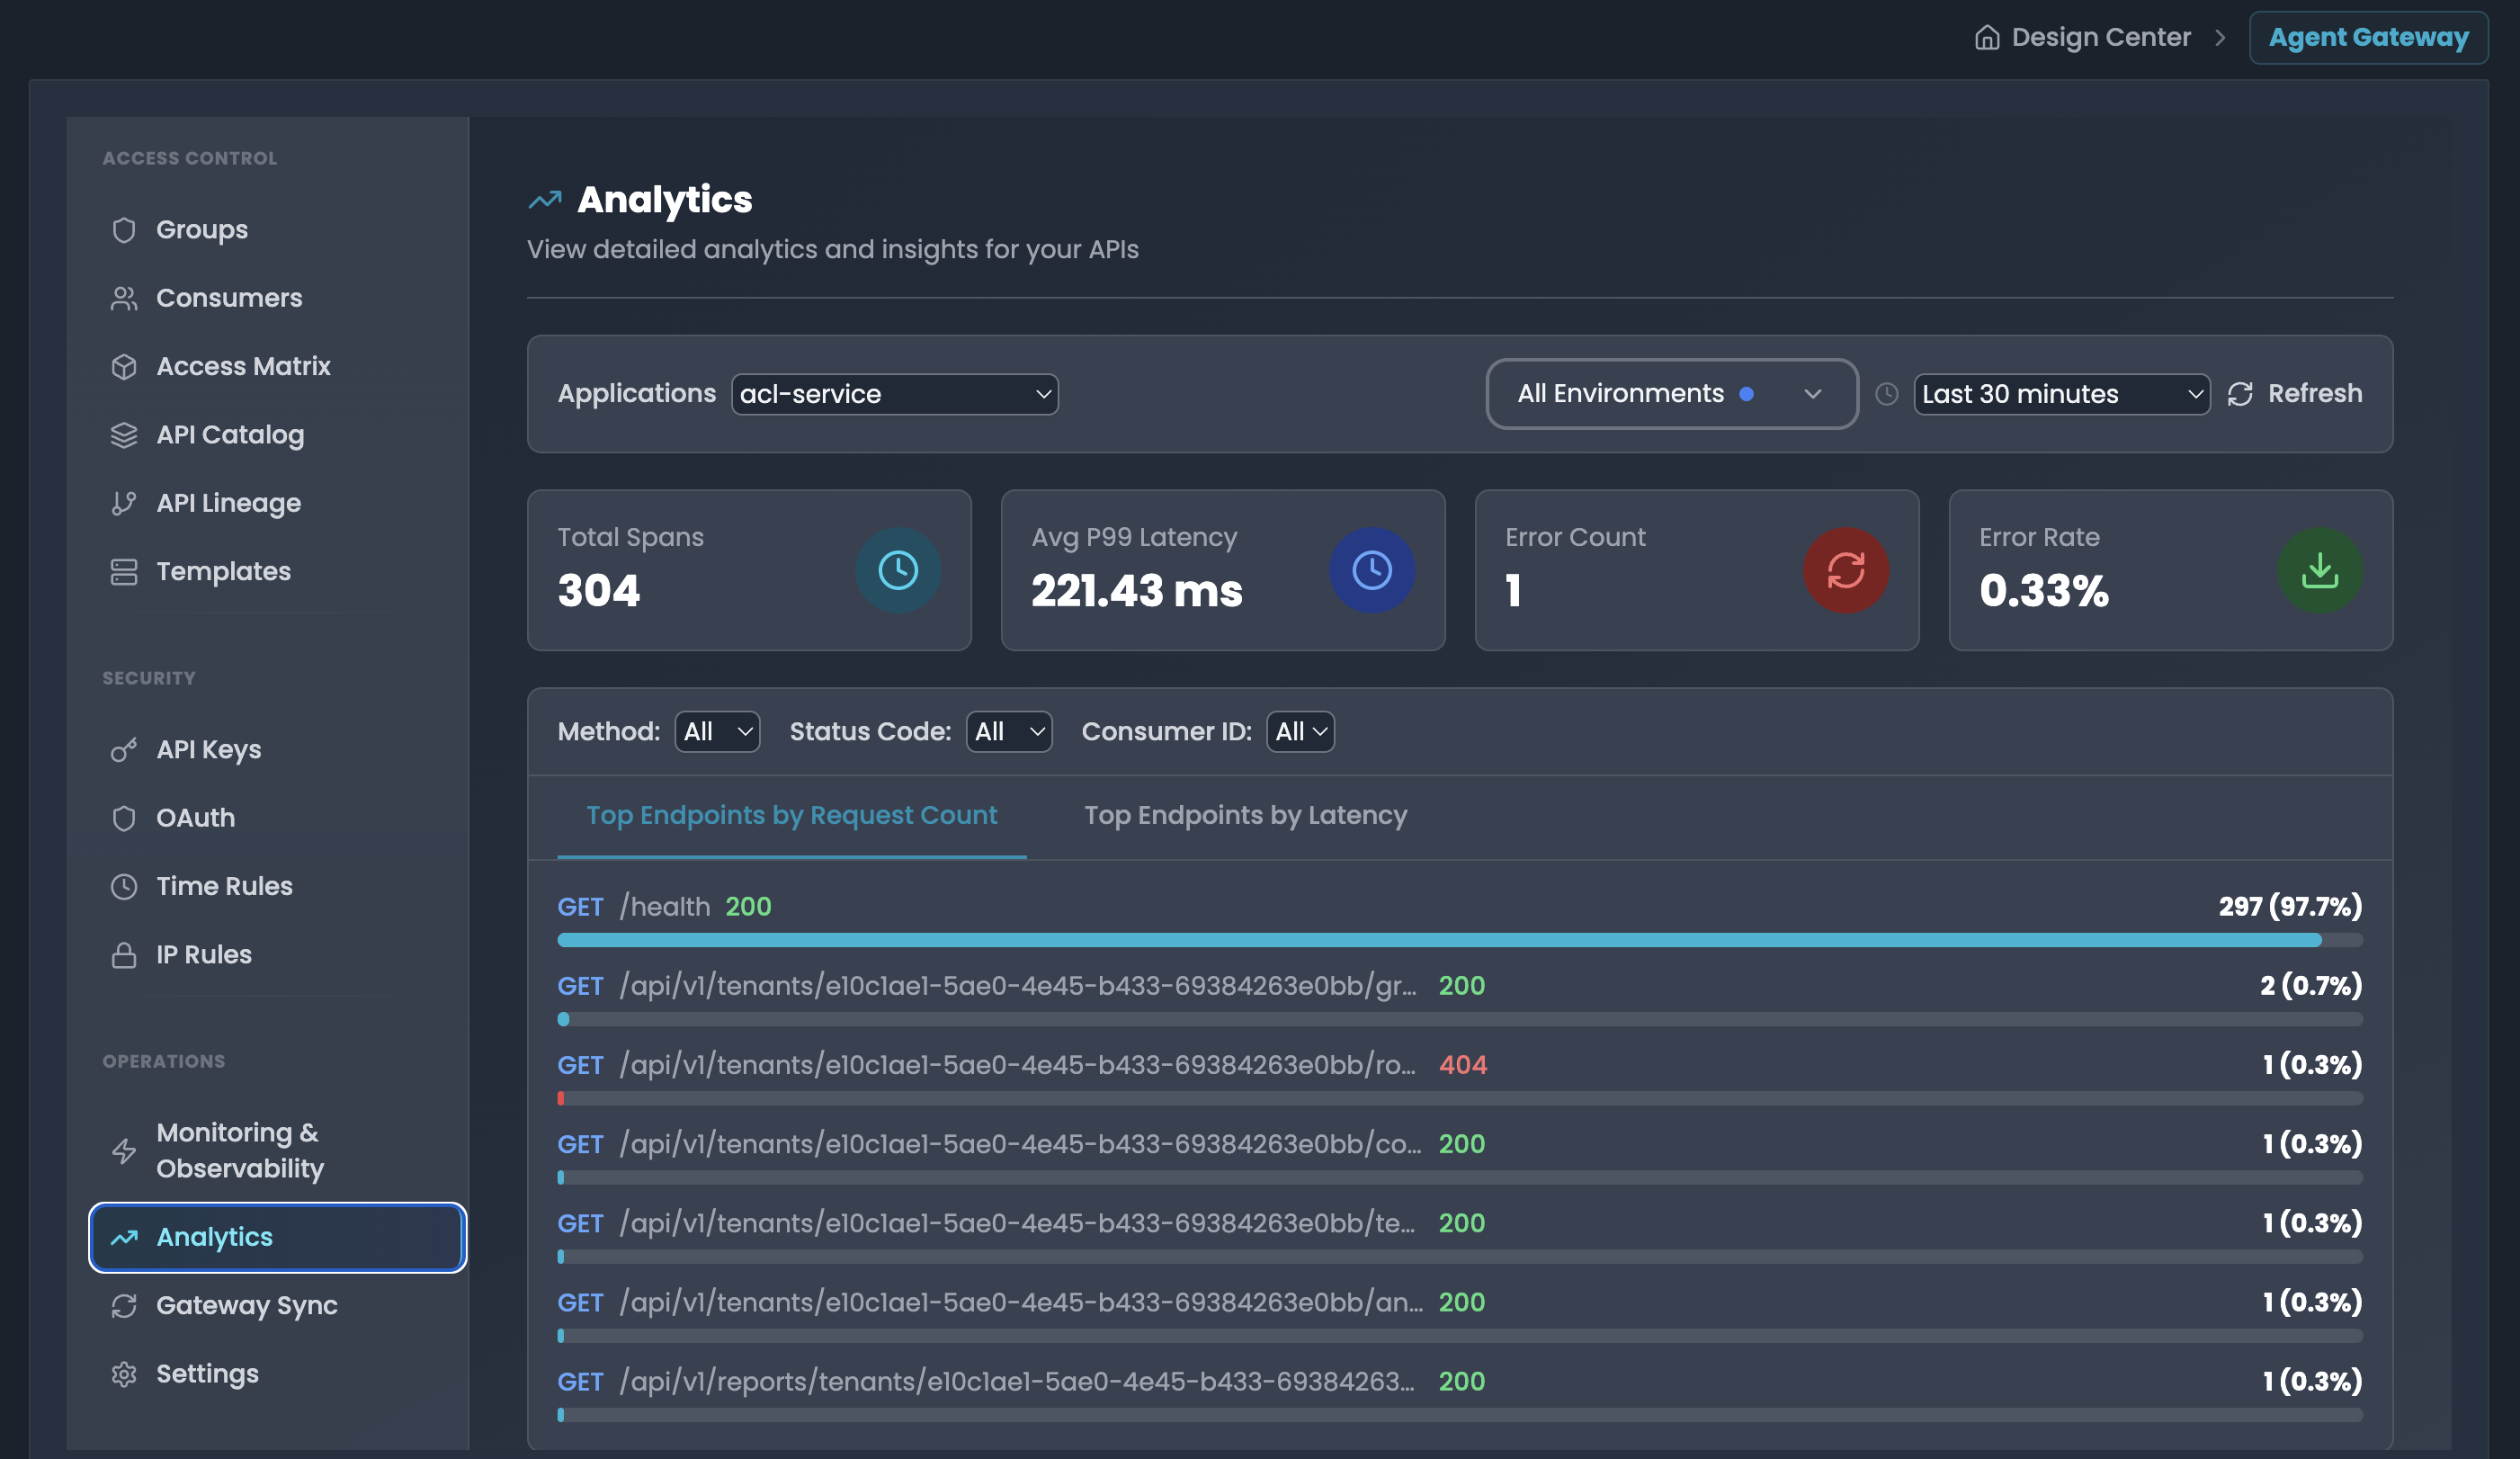
Filter Controls
- Applications: Select service/application (e.g., "acl-service")
- Environment: Toggle between development, production, staging
- Time Window: Last 5 min to 24 hours
- Filters: Method, Status Code, Consumer ID (dropdown selectors)
Summary Statistics
Four key metric cards:
- Total Spans: Total number of API requests
- Avg P99 Latency: Average 99th percentile latency in milliseconds
- Error Count: Total number of failed requests
- Error Rate: Percentage of failed requests
Top Endpoints Views
Two tabs for analyzing endpoint performance:
1. Top Endpoints by Request Count
- Lists endpoints sorted by number of requests
- Shows: Method, Path, Status Code, Request count with percentage
- Example:
GET /health 200 - 296 (98.7%) - Helps identify most frequently accessed endpoints
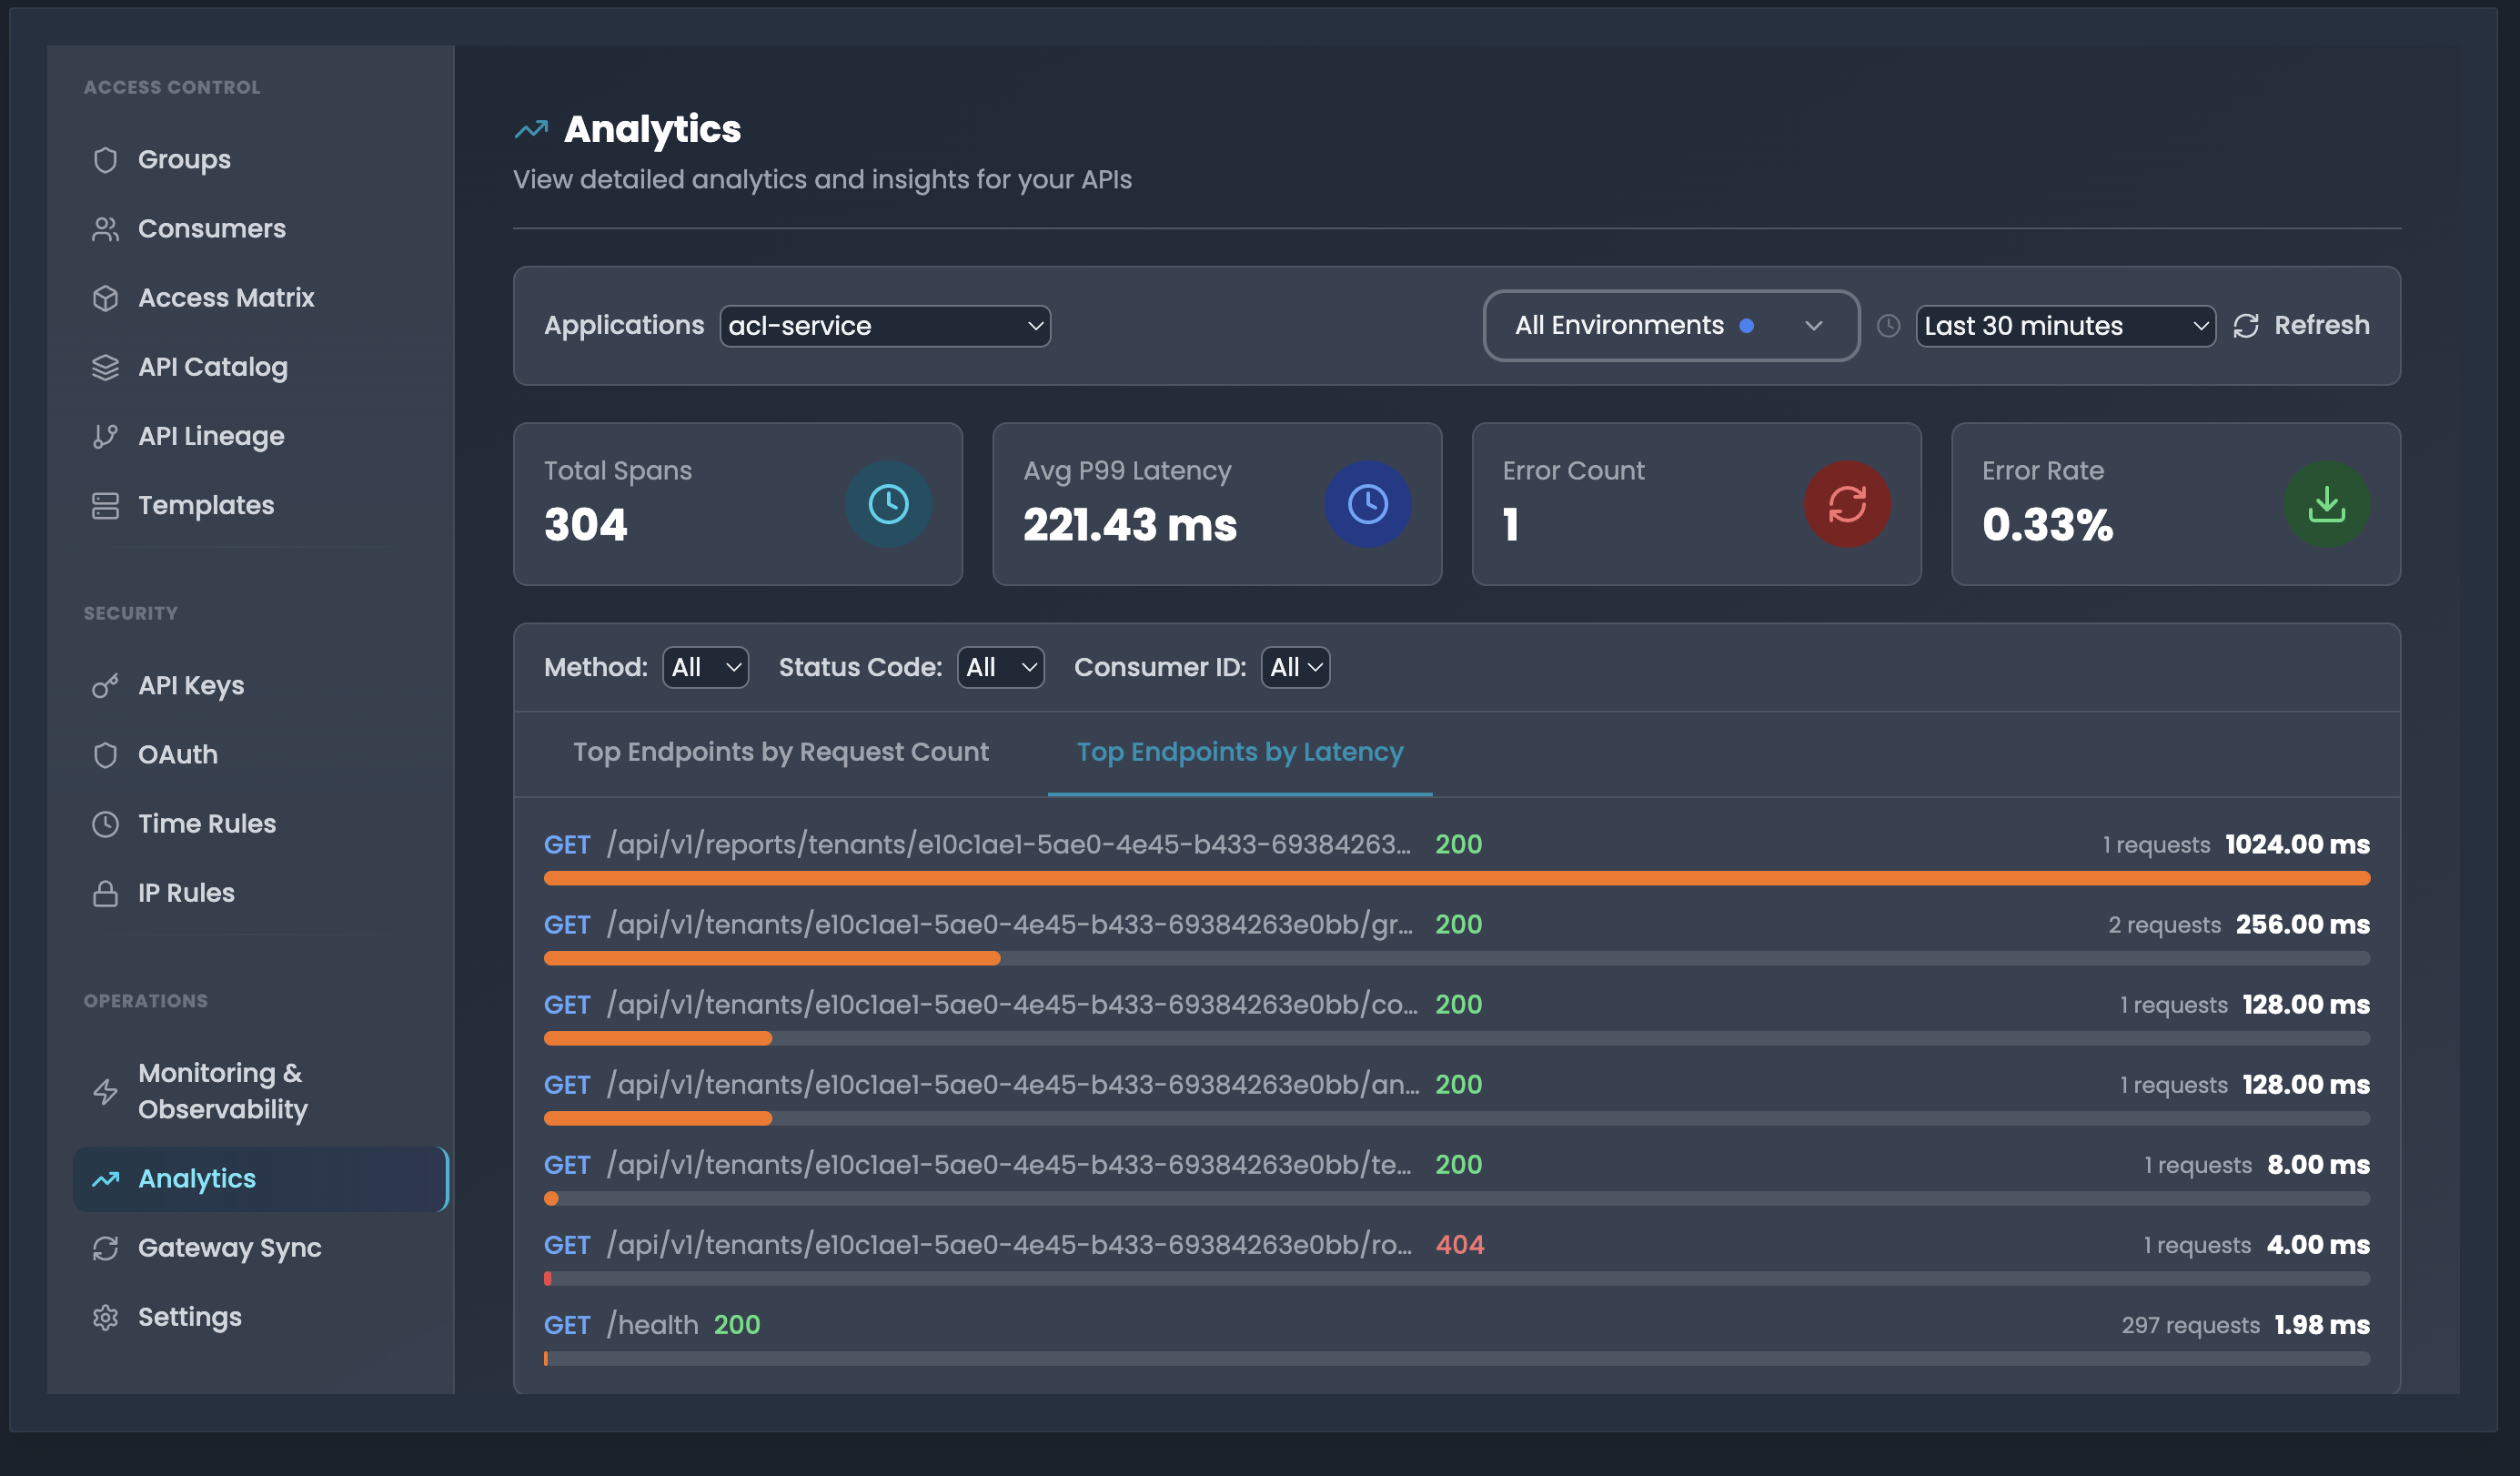
2. Top Endpoints by Latency
- Lists endpoints sorted by average latency
- Shows: Method, Path, Status Code, Request count, Average latency in ms
- Example:
GET /api/v1/tenants/... 200 - 2 requests 256.00 ms - Helps identify slowest endpoints
Use Cases
- Traffic Analysis: Identify highest traffic endpoints by request count
- Performance Optimization: Find slowest endpoints using latency view
- Error Monitoring: Track error count and error rate trends
- Capacity Planning: Use total spans to understand API load
- Service Health: Compare metrics across different applications and environments
Best Practices
- Review Top Endpoints by Request Count to identify hot paths
- Use Top Endpoints by Latency to prioritize optimization efforts
- Monitor error rate to detect service degradation
- Combine with Monitoring & Observability for detailed trace analysis
- Filter by specific methods or status codes to narrow analysis
Traceability
The FlowGenX workflow tracing system provides comprehensive monitoring and debugging capabilities for your workflow runs. This guide will help you effectively track, analyze, and troubleshoot your workflow executions.
Security Governance Overview
Comprehensive security and governance features for FlowGenX API management