Traceability
The FlowGenX workflow tracing system provides comprehensive monitoring and debugging capabilities for your workflow runs. This guide will help you effectively track, analyze, and troubleshoot your workflow executions.
Overview
Workflow tracing allows you to:
- Monitor all workflow executions in real-time
- Debug failed or problematic runs
- Analyze workflow performance and behavior
- Track data flow through each step
- Identify and resolve errors quickly
Viewing Workflow Runs
Accessing the Workflow Runs Section
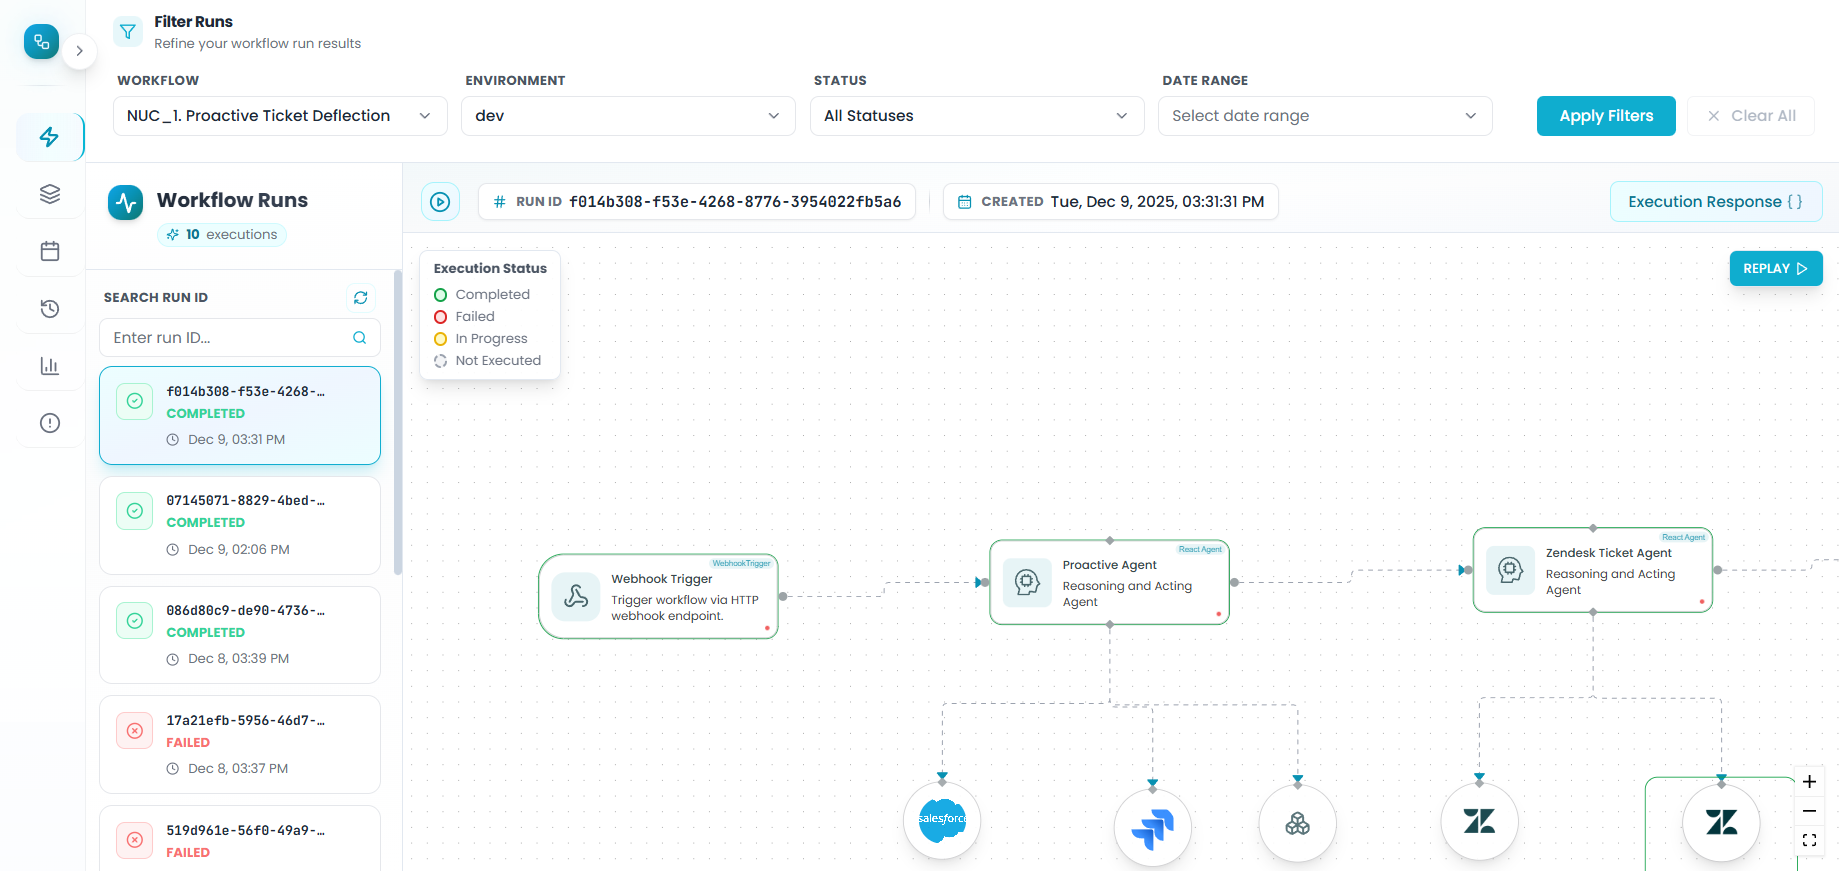
- Navigate to the Event Driven Workflows section from Flow Management
- You'll see a comprehensive list of all workflow executions
- Each entry displays key information including:
- Run ID
- Workflow name
- Execution timestamp
- Current status
Opening a Workflow Run
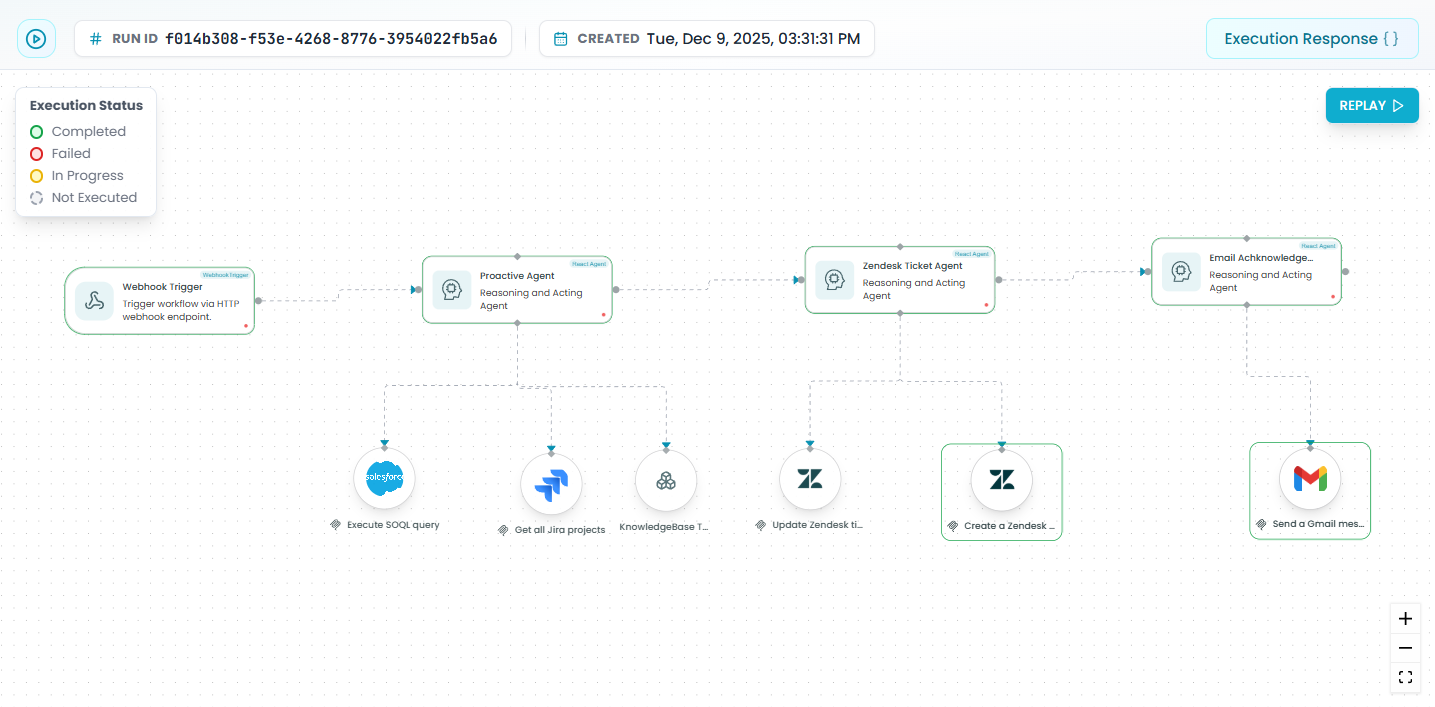
To view detailed information about a specific execution:
- Locate the workflow run you want to inspect
- Click on the Run ID to open the execution details
- A visual representation of the workflow will appear, displaying:
- The complete workflow structure
- Status indicators for each step
- The trigger that initiated the run
- All subsequent actions in sequence
Interpreting Status Messages
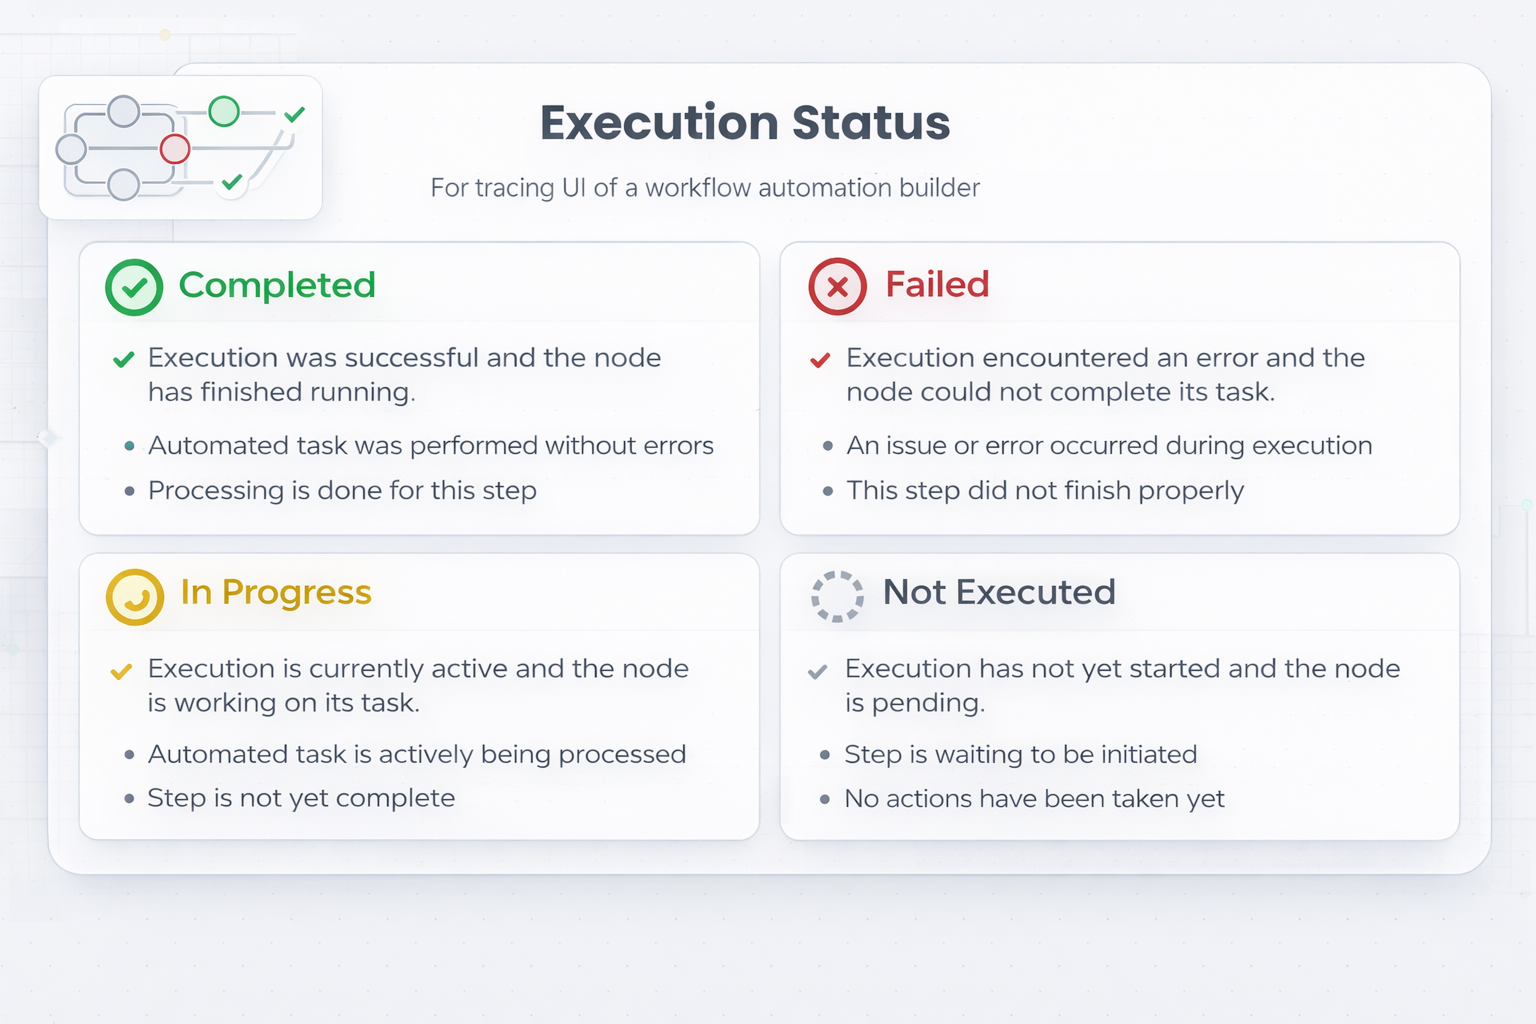
Each step in your workflow displays a status indicator that helps you understand its execution state:
Status Types
- Completed - The step completed successfully without errors
- Failed - The step encountered an error and did not complete
- In Progress - The step is currently executing
- Pending - The step is waiting to execute
- Not Executed - The step was bypassed based on workflow logic
Visual Indicators
The workflow visualization uses color coding and icons to make status identification quick and intuitive. Pay attention to these visual cues when scanning through your workflow execution.
Accessing Detailed Step Information
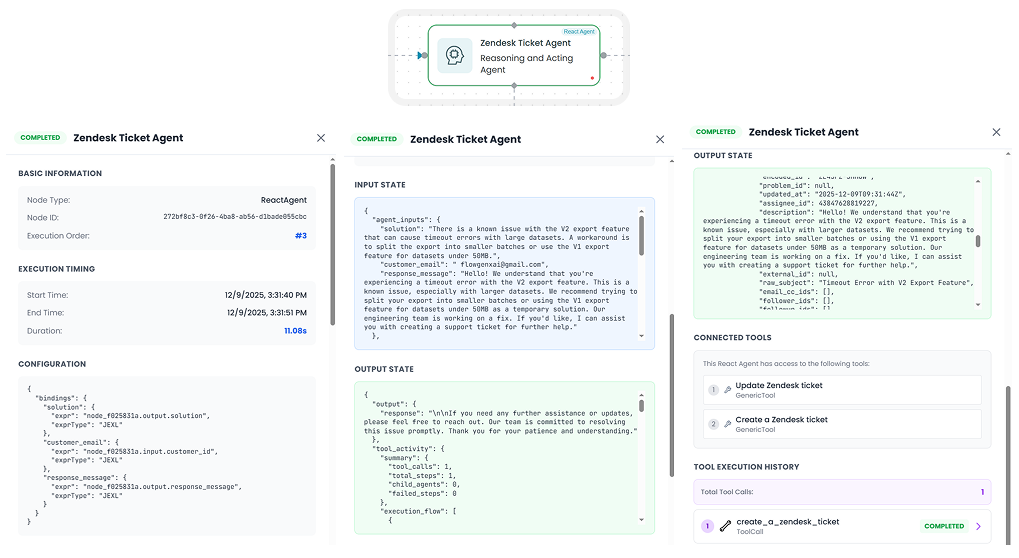
Selecting a Step
To view comprehensive details about any workflow step:
- Click on the specific step within the workflow visualization
- A detailed panel will open displaying step-specific information
Available Information
When you select a step, you can access:
Input Data
- View the exact data that was passed into the step
- Examine parameter values and configurations
- Understand the context in which the step executed
Output Data
- Review the data generated by the step
- Verify that the output matches expectations
- Use this information for debugging downstream steps
Error Messages
- If the step failed, detailed error messages will be displayed
- Review stack traces and error codes
- Identify the root cause of failures
Execution Metadata
- Step execution time
- Resource utilization
- Retry attempts (if applicable)
Workflow Replay
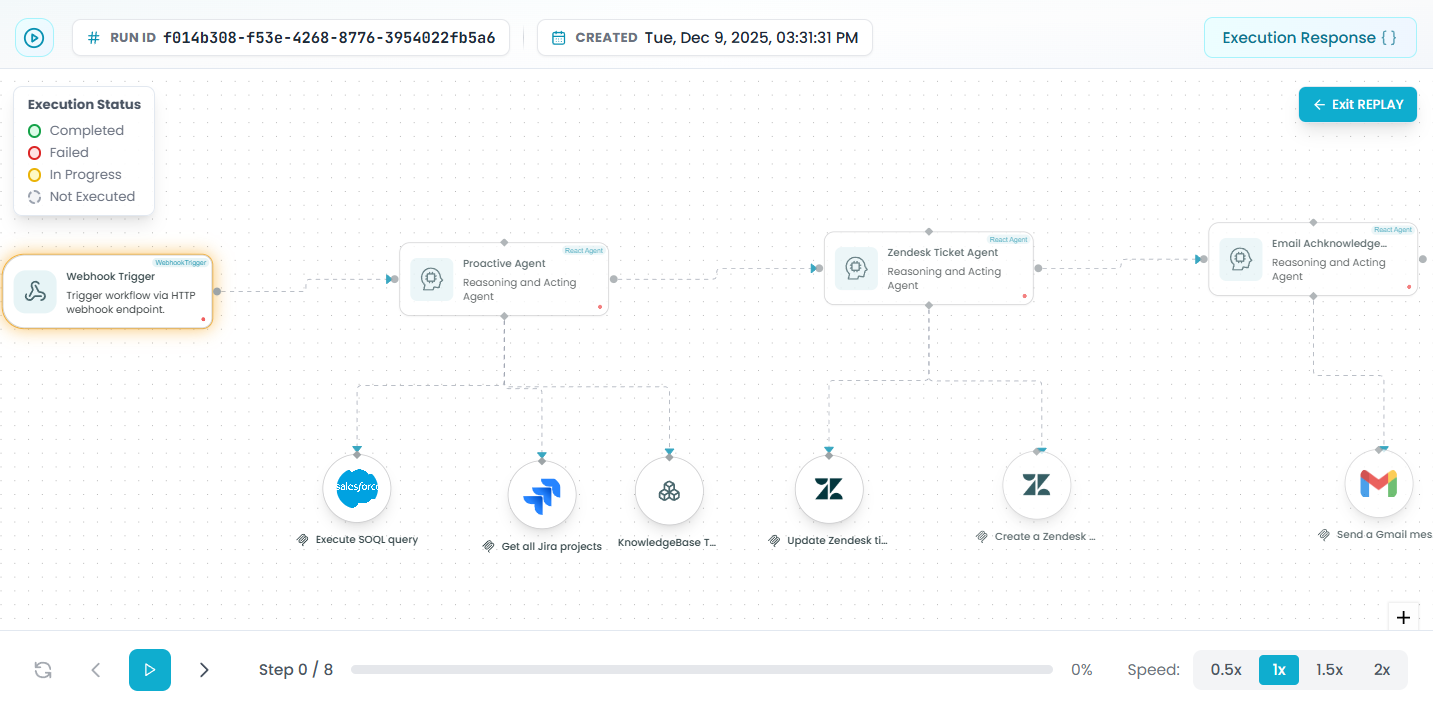
The Workflow Replay feature allows you to visualize and understand your workflow execution in an interactive, step-by-step manner. This powerful debugging and analysis tool helps you see exactly how data flows through your workflow and how each step processes information in real-time.
Accessing Replay Mode
- Open any completed workflow run from the Workflow Runs list
- Click the "Replay or Exit REPLAY" button in the top-right corner to toggle replay mode
- The workflow visualization will enter replay mode with playback controls
Replay Controls
At the bottom of the screen, you'll find the replay control panel with the following options:
Manual Step-Through
- Use the left arrow (←) button to move backward through steps
- Use the right arrow (→) button to move forward through steps
- Navigate through your workflow one step at a time to carefully examine each action
Automatic Playback
- Click the play button (▶) to start automatic replay
- The workflow will execute sequentially, showing each step's activation and completion
- Watch your workflow run like a movie, seeing the data flow in real-time
Speed Controls
Adjust the replay speed to match your analysis needs:
- 0.5x - Slow motion for detailed analysis of complex workflows
- 1x - Normal speed playback (default)
- 1.5x - Faster playback for familiar workflows
- 2x - Quick overview of long workflows
Progress Indicator
- The "Step 0 / 8" indicator shows your current position in the workflow
- The progress bar displays overall completion percentage
- Track exactly where you are in the execution sequence
Using Replay for Debugging
The replay feature is particularly useful for:
Understanding Execution Flow
- Visualize the exact order in which steps executed
- See how conditional logic affected the workflow path
- Identify which branches were taken and which were skipped
Analyzing Timing Issues
- Observe the duration between steps
- Identify bottlenecks or delays in execution
- Understand the impact of asynchronous operations
Data Flow Visualization
- Watch how data transforms as it moves through each step
- See when and where data is passed between actions
- Identify data transformation issues step-by-step
Comparing Successful and Failed Runs
- Replay successful runs to establish expected behavior
- Replay failed runs at slow speed to pinpoint failure moments
- Compare execution patterns between different runs
Best Practices for Replay
- Start with slow speed (0.5x) when debugging complex issues
- Use manual step-through when you need to examine input/output at each stage
- Use automatic playback at higher speeds for quick overviews or demonstrations
- Combine replay with step selection to view detailed information while watching execution
- Replay multiple runs of the same workflow to identify inconsistencies
Tips
- Pause automatic playback at any time by clicking the play button again
- You can click on any step during replay to view its detailed information
- The execution status legend on the left helps you quickly identify step outcomes during replay
- Use replay mode to create workflow demonstrations or training materials for your team
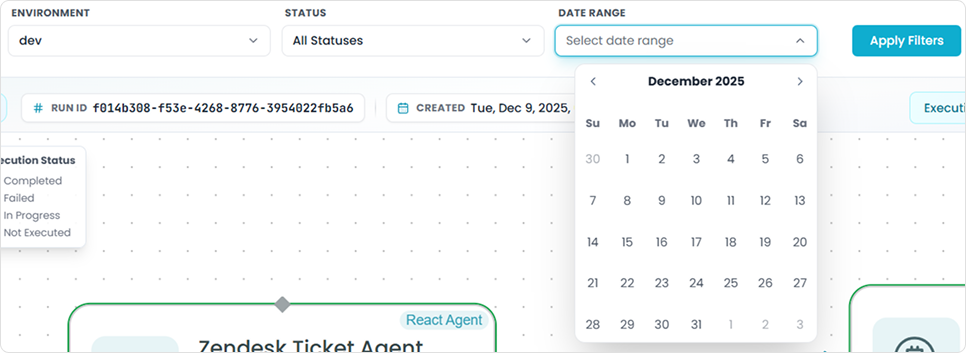
Utilizing Filters
The filtering system helps you quickly locate specific workflow runs without manually searching through long lists.
Available Filters
Filter by Workflow
- Select a specific workflow to view only its executions
- Useful when managing multiple workflows in your environment
Filter by Environment
- Choose between production, staging, development, or other environments
- Isolate runs from specific deployment contexts
Filter by Status
- Filter executions by their completion status
- Quickly find all failed runs that need attention
- Identify successful runs for performance analysis
Filter by Custom Date Range
- Specify a start and end date to narrow down results
- Useful for investigating issues during specific time periods
- Analyze workflow behavior over time
Applying Filters
- Locate the filter controls in the Workflow Runs section
- Select your desired filter criteria
- Apply the filters to refine the list
- Clear filters when you need to return to the full view
Combining Filters
You can apply multiple filters simultaneously to create highly specific searches. For example:
- Filter by a specific workflow AND failed status AND last 7 days
- This combination helps you quickly identify recent failures for a particular workflow
Best Practices
Regular Monitoring
- Check workflow runs regularly to catch issues early
- Set up alerts for failed executions
- Review successful runs to establish performance baselines
Debugging Workflow Issues
- Start by filtering for failed runs
- Examine the visual workflow to identify where failures occur
- Click on failed steps to review error messages
- Check input data to verify it matches expectations
- Review output from previous steps to identify data issues
Performance Analysis
- Use date range filters to compare workflow performance over time
- Analyze execution duration for optimization opportunities
- Identify bottlenecks by examining step-by-step execution times
Troubleshooting Tips
- Multiple Step Failures: If several steps fail, start debugging from the first failure, as subsequent failures may be cascading effects
- Inconsistent Results: Use filters to compare successful and failed runs of the same workflow to identify patterns
- Missing Data: Check the input section of each step to verify data is being passed correctly through the workflow
- Timeout Issues: Review execution metadata to identify steps that are taking longer than expected
Monitoring & Observability
Monitor workflow execution, track performance, and troubleshoot issues.
Analytics
Analytics is a comprehensive API performance monitoring and insights dashboard that helps you analyze API usage patterns and performance metrics across your gateway. It provides aggregated statistics and visualizations to help you understand how your APIs are performing and being used.