Monitoring & Observability
Monitor workflow execution, track performance, and troubleshoot issues.
Monitor API performance metrics and distributed tracing powered by Tempo and OpenTelemetry.
Accessing
- Navigate to Operations → Monitoring & Observability
- Select environment and choose between API Table or Logs tabs
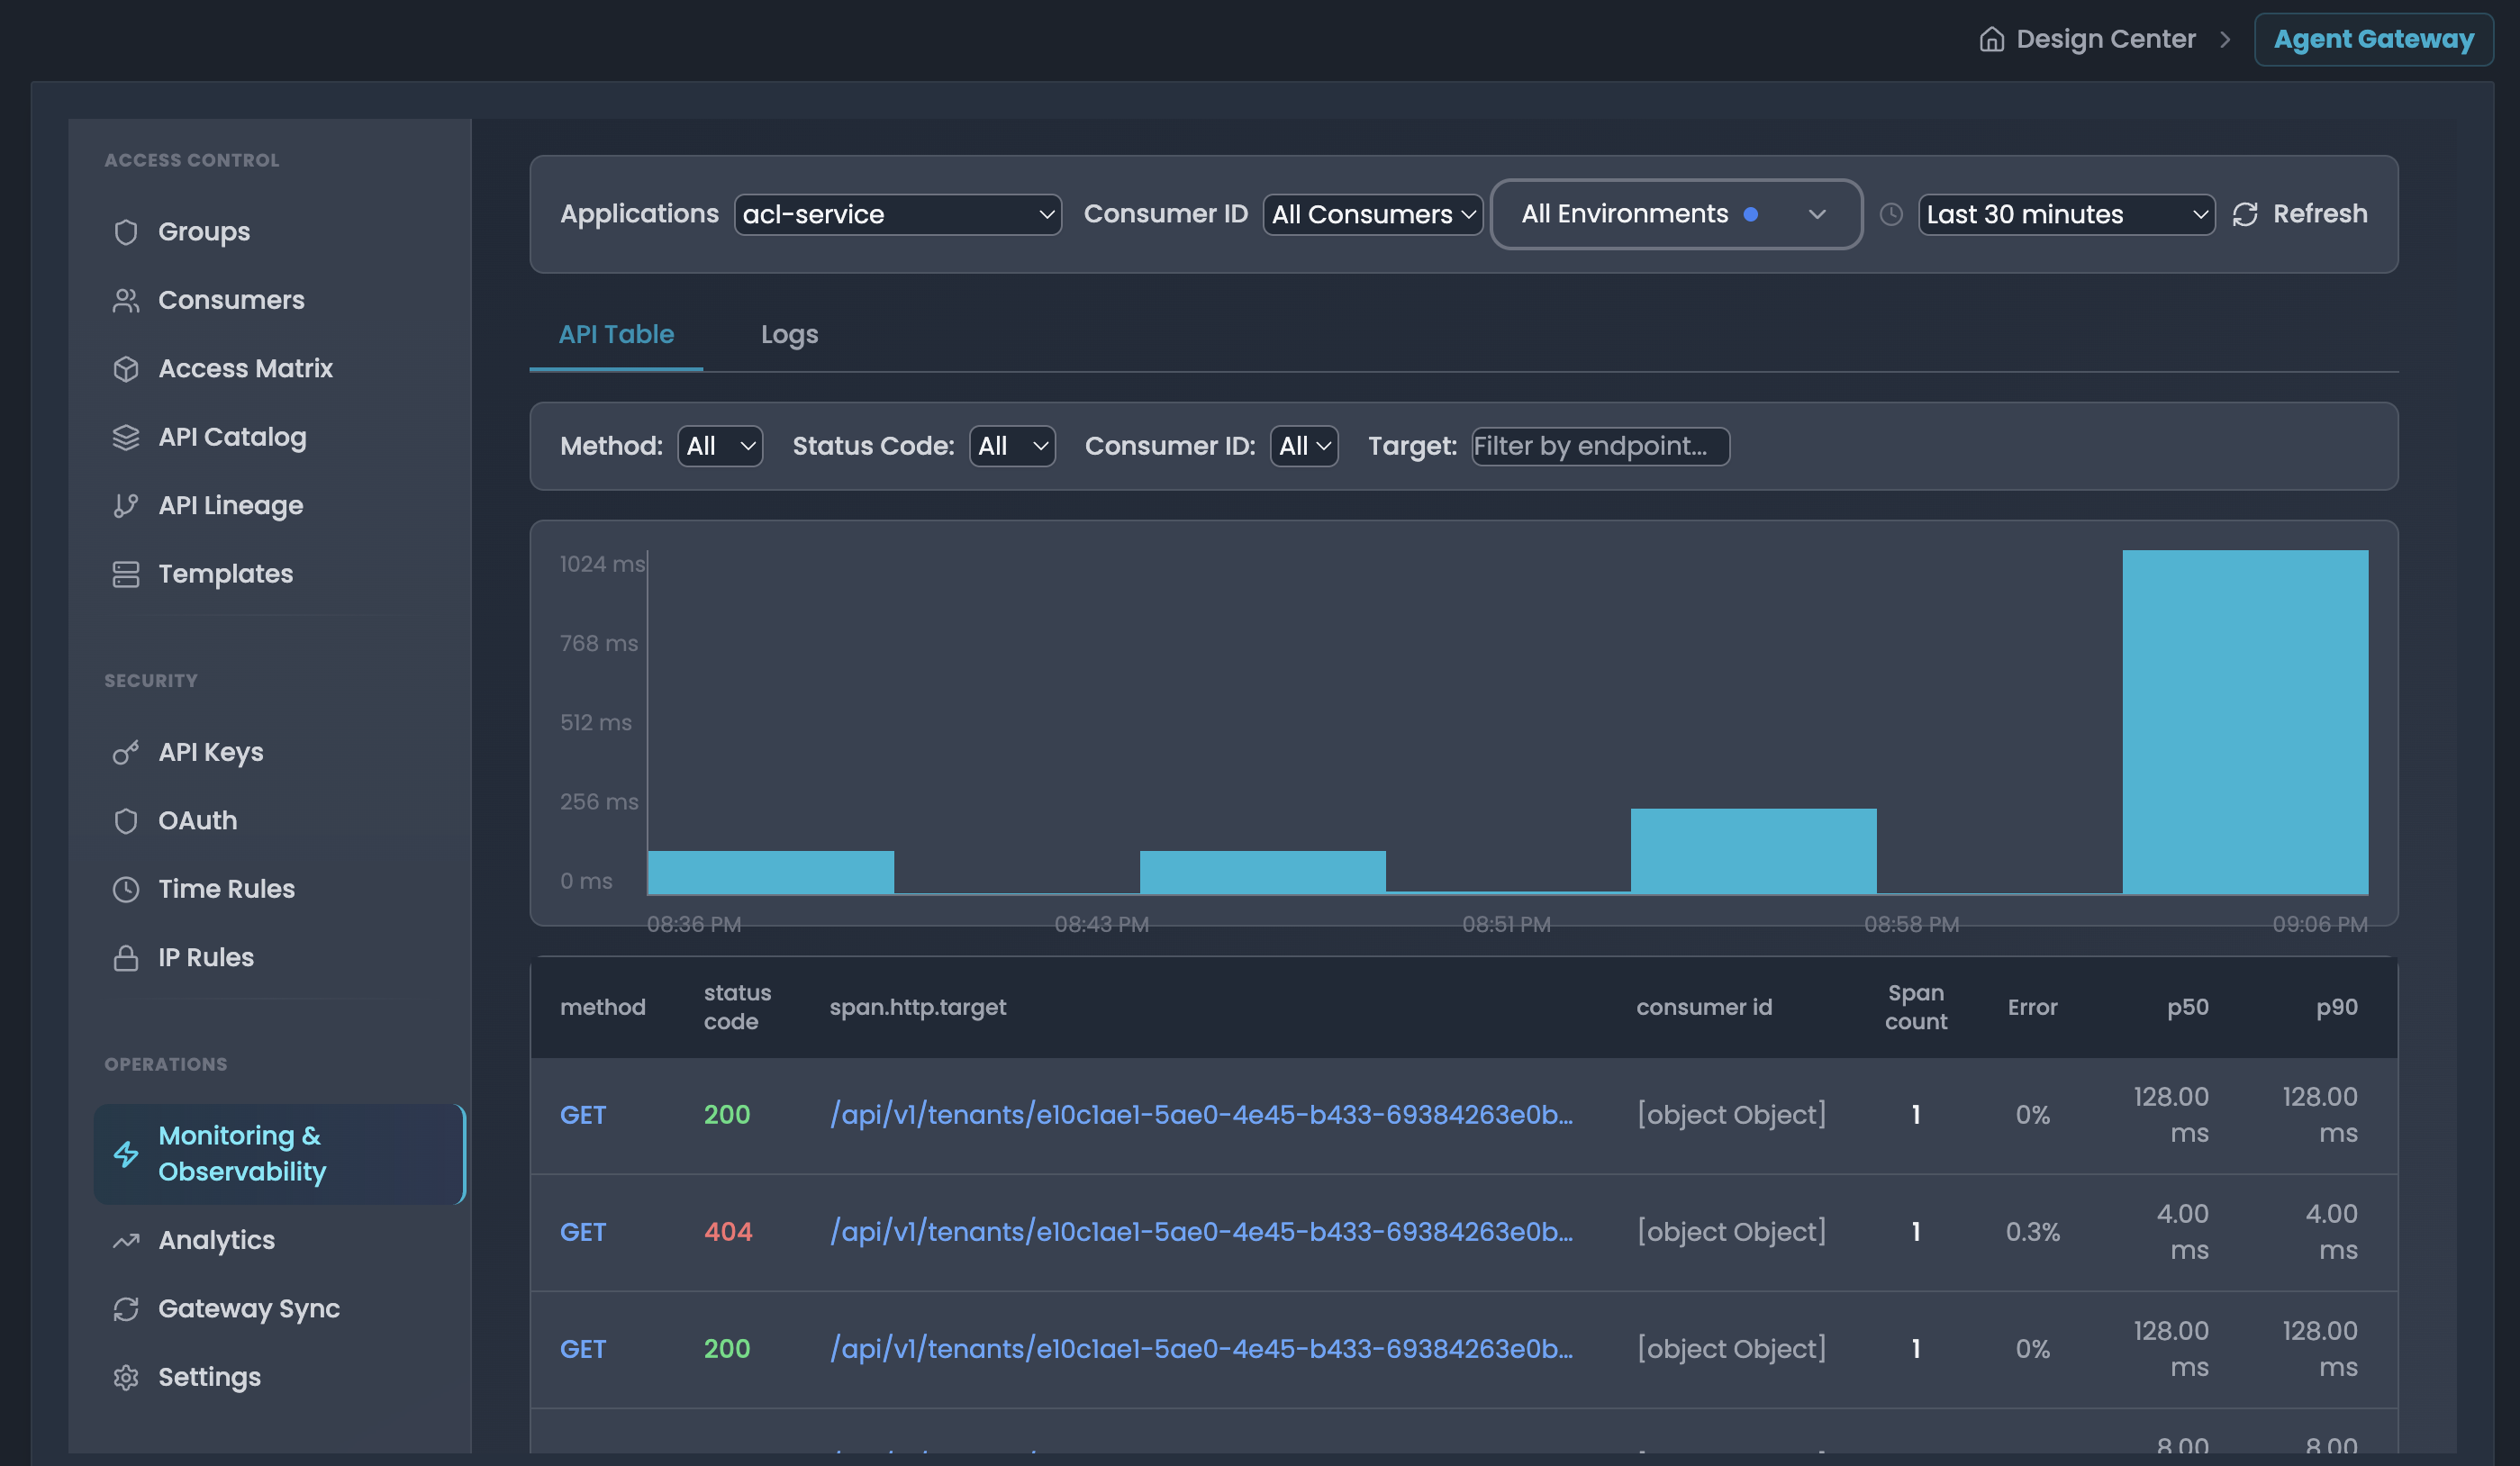
API Table - Performance Metrics & Distributed Tracing
Filter Controls
- Applications: Select service/application (e.g., "workflow-api")
- Consumer ID: Filter by specific consumer (optional)
- Environment: Toggle between development, production, staging
- Time Window: Last 5 min to 24 hours
- Advanced Filters: Method, Status Code, Consumer ID, Target (multi-select)
Performance Metrics Table
Displays aggregated statistics per endpoint:
- method: HTTP method (GET, POST, PUT, PATCH, DELETE)
- status code: HTTP status code
- span.http.target: API endpoint path
- consumer id: Consumer identifier
- Span count: Total requests
- Error: Failed requests (status >= 400)
- p50, p90, p95, p99: Latency percentiles in milliseconds
Features:
- Sort by any column
- Click row to view individual traces
- Latency chart shows p99 trends over time
Trace Details Modal
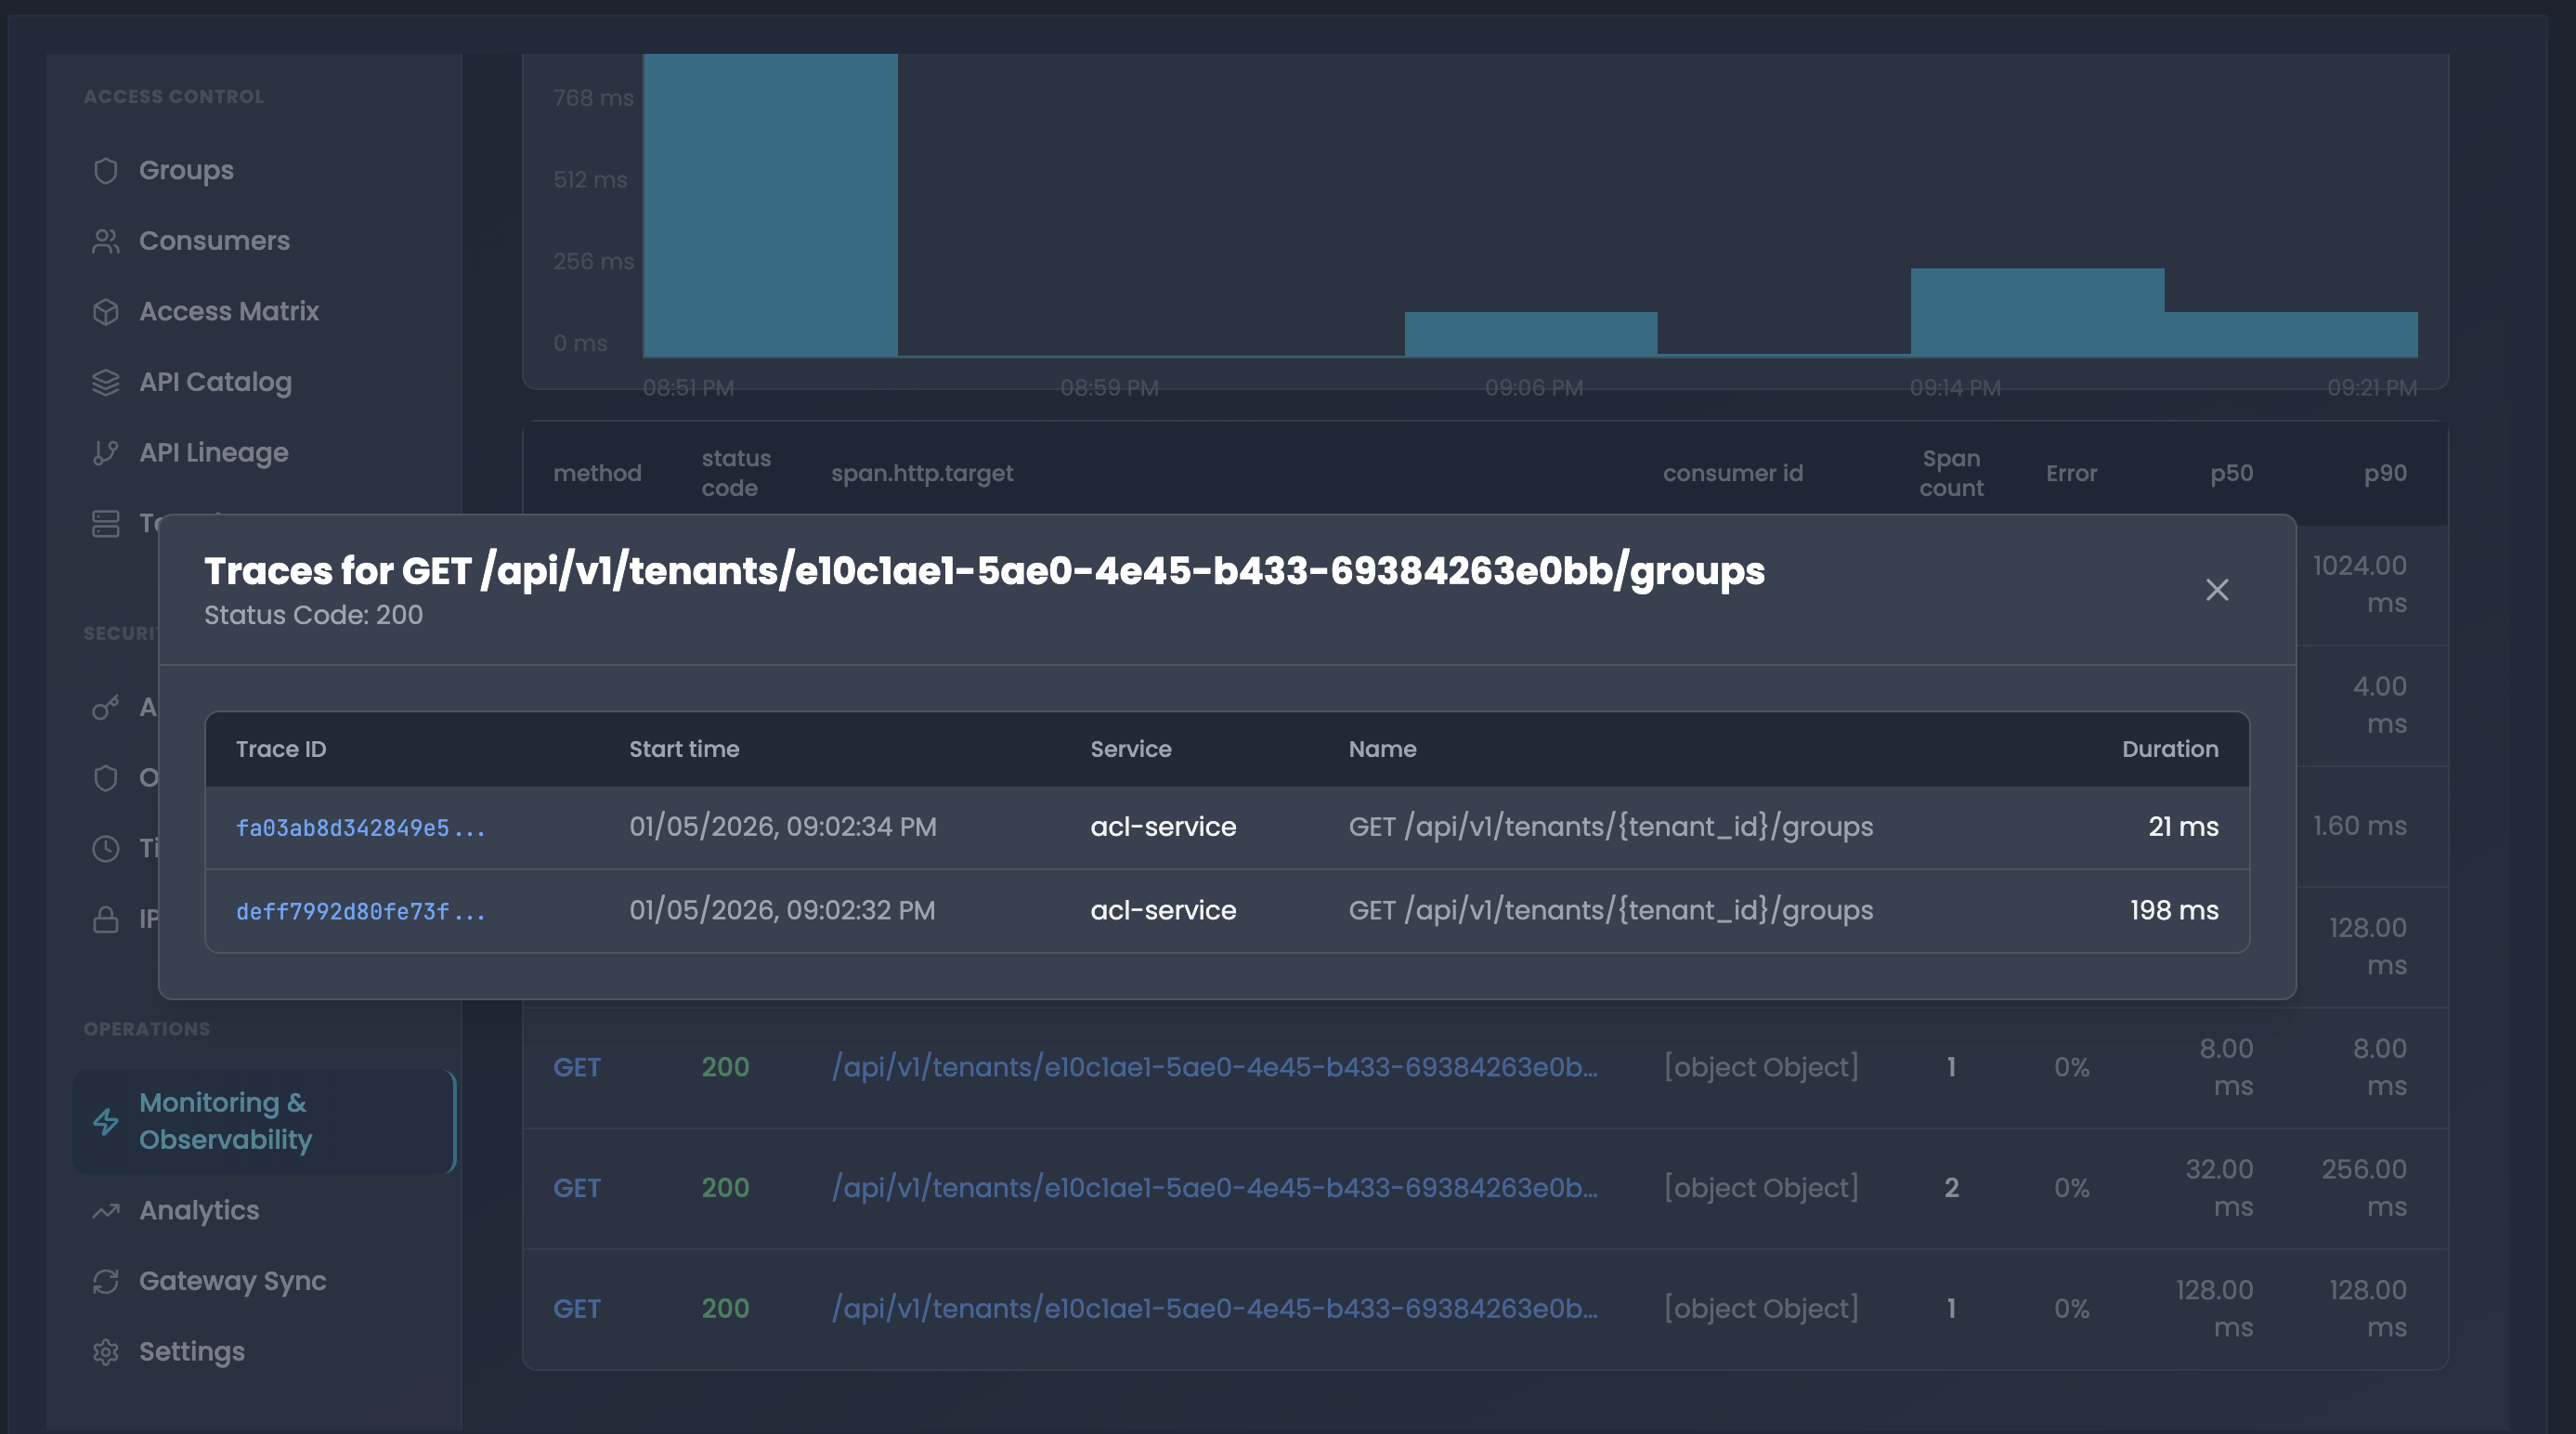
Click endpoint row to view traces with:
- Trace ID: Links to Grafana trace visualization
- Start time: Full timestamp
- Service: Root service name
- Name: Operation name
- Duration: Request duration in milliseconds
Use Cases
- Performance Debugging: Sort by p99 latency to find slow endpoints, drill into traces
- Error Analysis: Filter by error status codes (500, 502, 503) to identify failures
- Consumer Troubleshooting: Filter by consumer ID to debug user-specific issues
- Endpoint Comparison: Compare latency percentiles across multiple endpoints
Logs - Applications API Logs
Real-time application API logs in terminal-style interface.
Controls
- Time Window: Last 5 min to 6 hours
- Refresh: Manual reload button
Log Display
- Dark terminal theme with monospace font
- Each line shows:
[Timestamp] [Log Message] - Sorted by timestamp (newest first)
- Source: Application container logs (e.g.,
{container="kong"})
Use Cases
- Real-Time Monitoring: Set to "Last 5 minutes" and refresh periodically
- Error Investigation: Search for error keywords, correlate with API Table metrics
- Request Tracing: Find requests by timestamp or correlation ID
- Application Debugging: Review application-level logs for errors and warnings
Best Practices
- Use API Table for trends and p99 latency monitoring
- Use Logs for detailed application-level debugging
- Click trace IDs to analyze in Grafana
- Keep time windows short (5-30 min) for faster queries
- Combine both views for comprehensive troubleshooting
Deploying and Scheduling Workflows
Deploy workflows to production, configure automated schedules, and manage deployment lifecycles across environments.
Traceability
The FlowGenX workflow tracing system provides comprehensive monitoring and debugging capabilities for your workflow runs. This guide will help you effectively track, analyze, and troubleshoot your workflow executions.