Playground
Test and experiment with your MCP tools in an interactive chat environment
The Agent Playground provides an interactive chat interface to test your MCP servers and tools before deploying them to production. After configuring your MCP server, use the Playground to validate tool behavior, debug issues, and see exactly how AI models interact with your integrations.
Interactive Tool Testing
Chat with AI models and watch your tools execute in real-timeOverview
The Playground simulates how AI agents interact with your MCP tools. You can:
- Select an MCP Server: Choose which connected app's tools to test
- Pick Active Tools: Enable specific tools for the session
- Choose an AI Model: Test with different models (GPT-4o, Claude, etc.)
- Chat Naturally: Ask the AI to perform tasks using your tools
- Monitor Execution: Watch tool calls, parameters, and results in real-time
Getting Started
Step 1: Access the Playground
Navigate to Integration Studio → Playground to open the testing environment.
Step 2: Select Your MCP Server
From the MCP Server dropdown, select the server you want to test:
Step 3: Configure Active Tools
Once you select an MCP server, you'll see all available tools in the left panel:
- Tools Tab: Browse and enable/disable specific tools
- Search: Filter tools by name or description
- Tool Cards: Each tool shows its name, description, and status
Click on tools to add them to your active session. Only enabled tools will be available to the AI model.
Step 4: Select an AI Model
At the bottom of the chat interface, select which AI model to use for testing:
| Model | Best For |
|---|---|
| GPT-4o Mini | Quick tests, lower cost |
| GPT-4o | Complex reasoning, multi-step tasks |
| Claude 3.5 Sonnet | Detailed analysis, longer contexts |
| Claude 3 Opus | Most capable, complex operations |
Step 5: Start Chatting
Type your request in the chat input and send. The AI will:
- Understand your request
- Decide which tools to use
- Execute the tools with appropriate parameters
- Return the results in a conversational format
The Playground Interface
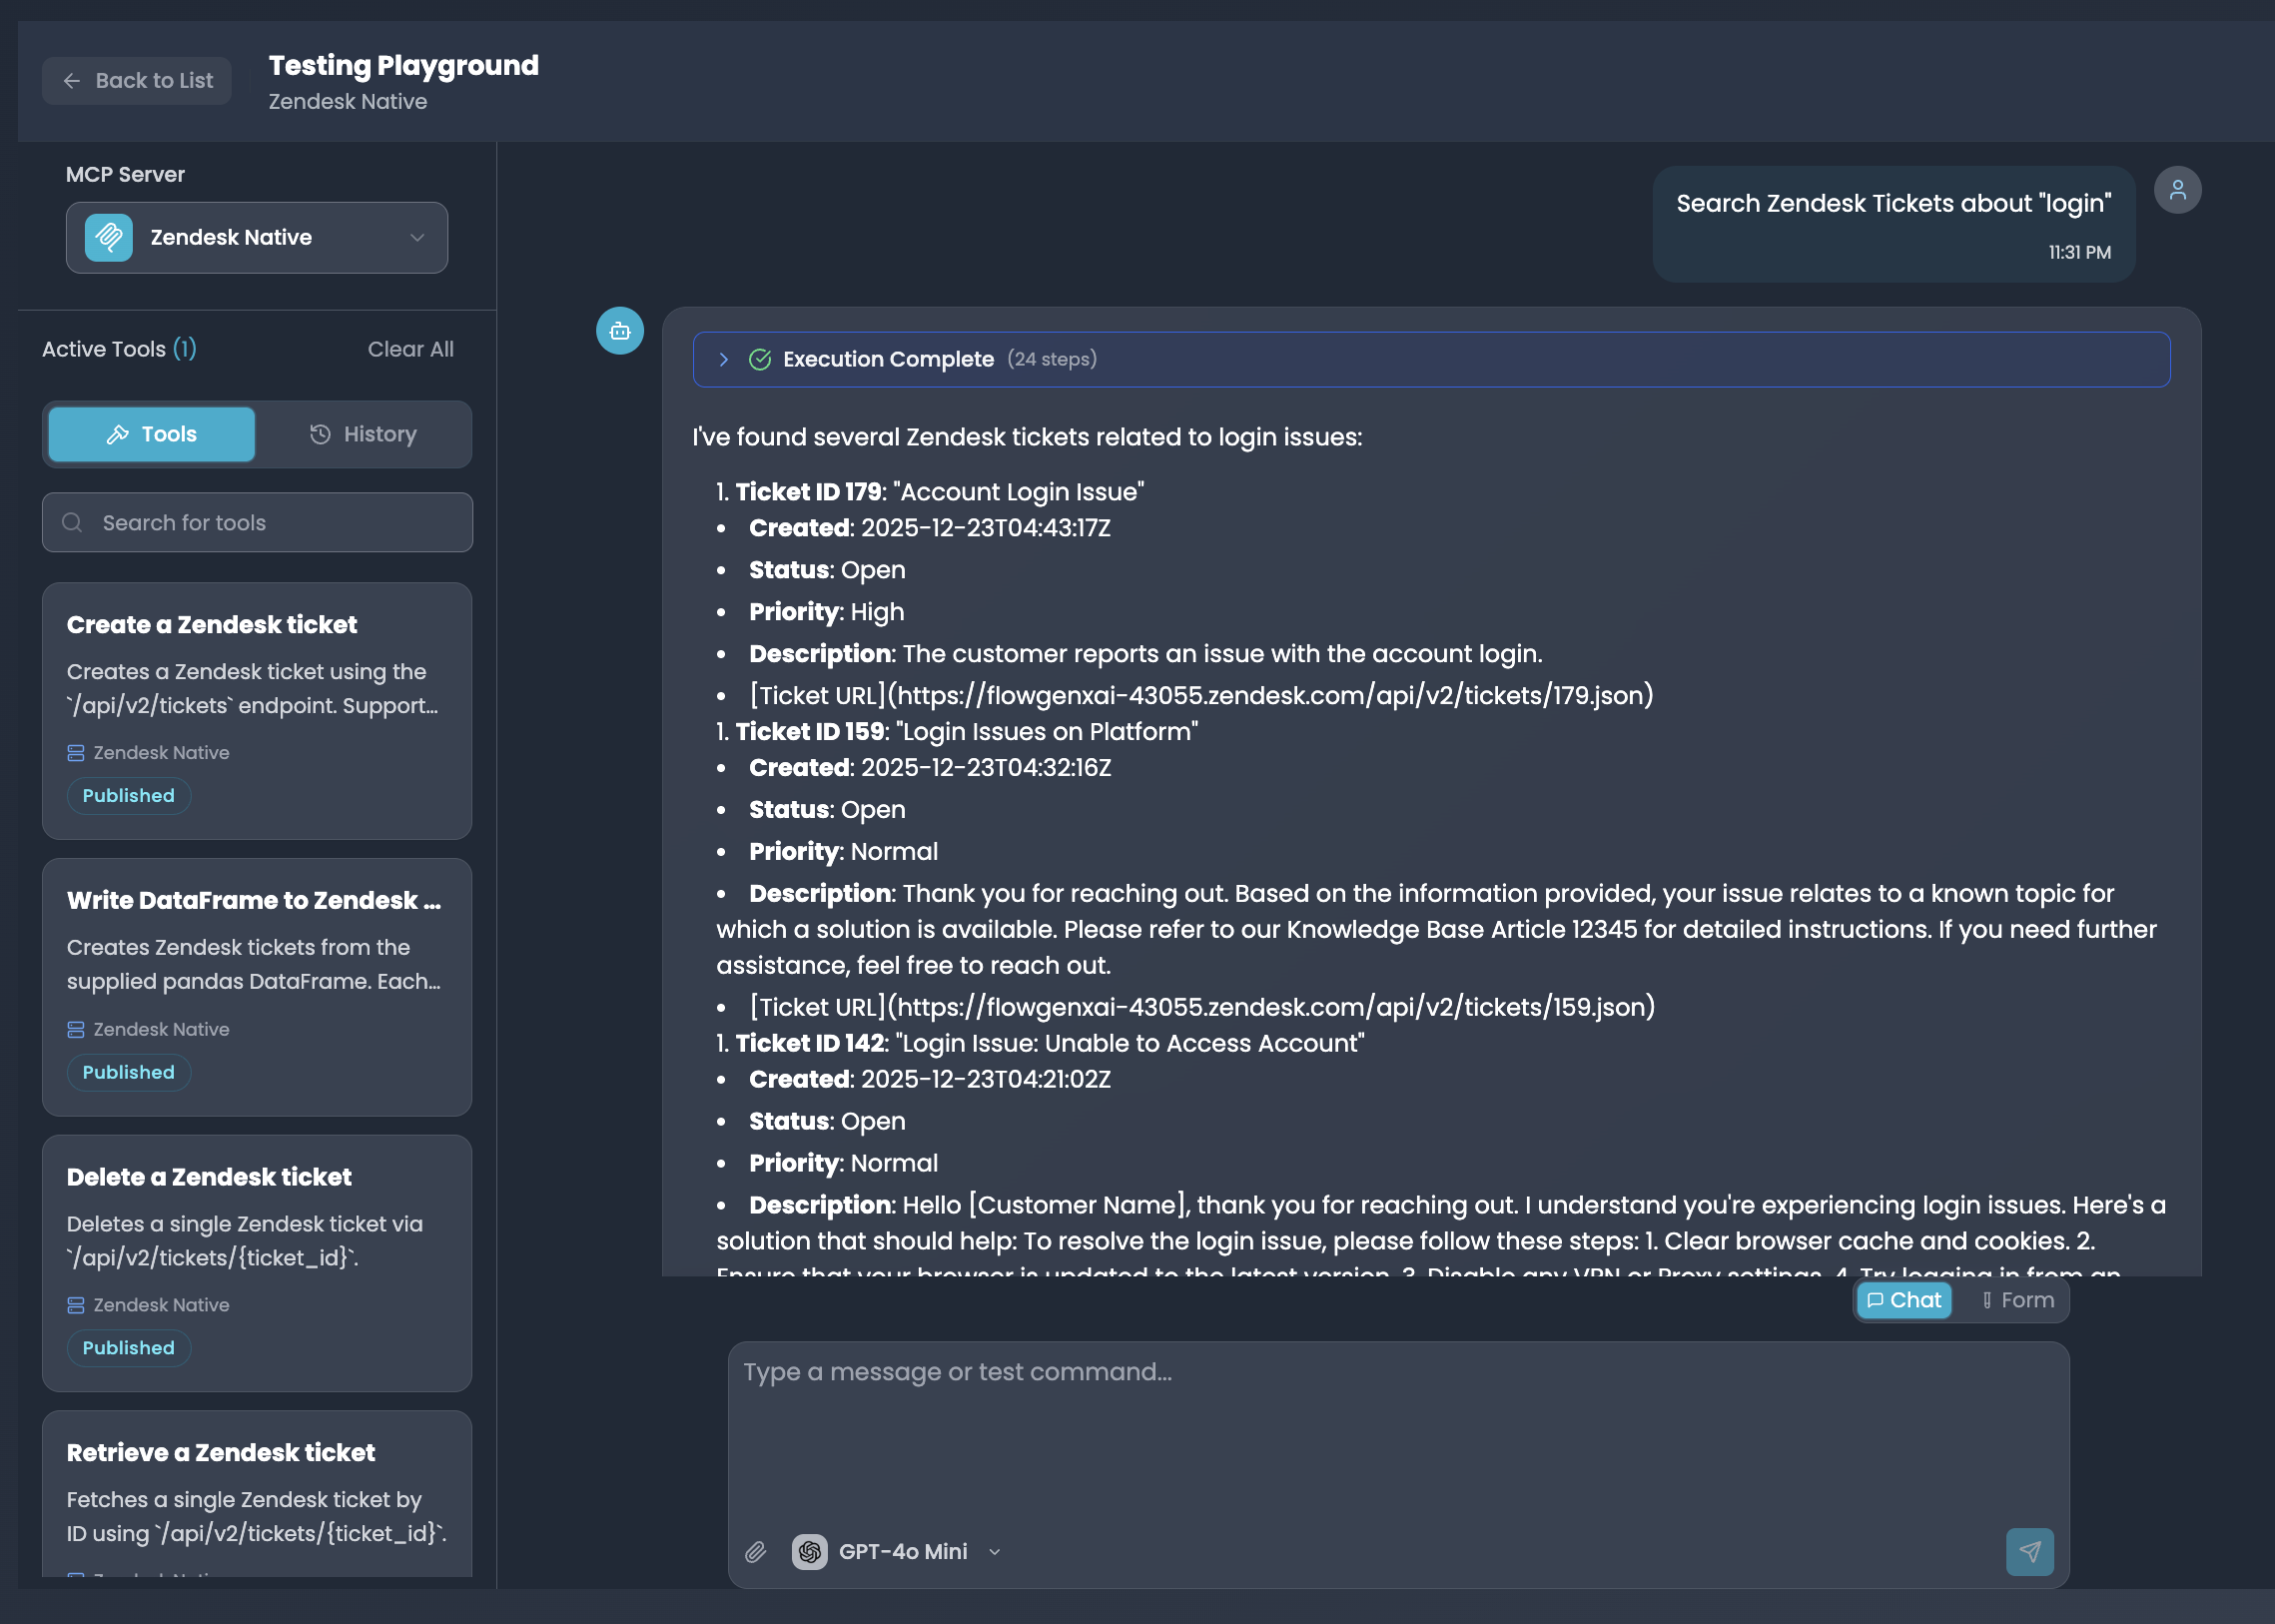
The Playground interface with Zendesk MCP server, active tools, and a completed search query
Interface Components
MCP Server Selector
Dropdown to choose which MCP server's tools to test. Shows server name and connected app icon.Tools Panel
Left sidebar showing available tools with search, descriptions, and publish status. Toggle tools on/off for your session.Chat Area
Main conversation view with your messages, AI responses, and inline execution results with full details.History Tab
View past test sessions and their results. Useful for comparing tool behavior across different prompts.Execution Monitoring
One of the Playground's most powerful features is real-time execution monitoring. When the AI uses your tools, you can see every step of the process.
Execution Progress
When a tool executes, you'll see an expandable Execution Complete section showing:
- Step Count: Total number of execution steps (e.g., "24 steps")
- Status: Success, failure, or in-progress indicator
- Expandable Details: Click to see full execution log
What You Can Monitor
| Information | Description |
|---|---|
| Tool Called | Which tool the AI decided to use |
| Parameters | Exact input values passed to the tool |
| API Requests | Underlying API calls made to the connected app |
| Response Data | Raw data returned from the tool |
| Execution Time | How long each step took |
| Errors | Any errors with full stack traces |
Example: Search Results
When searching for data (like Zendesk tickets), you'll see structured results:
I've found several Zendesk tickets related to login issues:

1. Ticket ID 179: "Account Login Issue"
   - Created: 2025-12-23T04:43:17Z
   - Status: Open
   - Priority: High
   - Description: The customer reports an issue with the account login...

2. Ticket ID 159: "Login Issues on Platform"
   - Created: 2025-12-23T04:32:16Z
   - Status: Open
   - Priority: Normal
   - Description: Thank you for reaching out...
Testing Workflows
Basic Tool Testing
Test individual tools with simple prompts:
"Search Zendesk tickets about 'login'"
"Create a new contact with name John Doe and email john@example.com"
"Get the status of order #12345"
"List all open support tickets"
Multi-Tool Operations
Test complex workflows that require multiple tools:
"Find the customer John Smith, then create a support ticket
for them about a billing issue"
The AI will:
- Use the search tool to find John Smith
- Use the create ticket tool with John's customer ID
- Return confirmation of both operations
Edge Case Testing
Test how tools handle unusual inputs:
| Test Case | Example Prompt |
|---|---|
| Empty results | "Search for tickets about 'xyz123nonexistent'" |
| Invalid input | "Create a contact without an email" |
| Large data | "List all customers" (test pagination) |
| Special characters | "Search for tickets about 'user@domain.com'" |
Error Handling
Test how tools respond to errors:
"Delete ticket with ID 99999999"  // Non-existent ID
"Create a duplicate contact"       // Constraint violation
"Access restricted data"           // Permission error
Chat vs Form Mode
The Playground offers two input modes:
Chat Mode
Natural language interface for conversational testing:
- Type requests as you would to an AI assistant
- Great for testing how AI interprets user intent
- Best for complex, multi-step operations
Form Mode
Structured input for precise tool testing:
- Select a specific tool from a dropdown
- Fill in each parameter explicitly
- Execute with exact values you specify
- Best for testing specific parameter combinations
Toggle between modes using the Chat / Form button in the input area.
Working with Tool Results
Understanding Response Format
Tool responses in the Playground show:
- Conversational Summary: AI's natural language interpretation
- Structured Data: Formatted results (lists, tables, etc.)
- Raw Response: Expandable view of the actual API response
- Execution Metadata: Timing, steps, and status
Copying Results
You can copy:
- The full AI response
- Individual data fields
- Raw JSON responses
Use copied data to verify results in the actual connected application.
Debugging Tools
Common Issues and Solutions
| Issue | Symptom | Solution |
|---|---|---|
| Tool not appearing | Tool missing from list | Check tool is published in MCP Hub |
| Authentication error | 401/403 in execution log | Verify Auth Config credentials |
| Wrong tool selected | AI uses unexpected tool | Improve tool description clarity |
| Missing parameters | Validation errors | Update schema with better descriptions |
| Timeout | Execution hangs or fails | Increase timeout in MCP tool config |
Using Execution Logs
Click on Execution Complete to expand detailed logs:
- Identify the failing step: Look for red status indicators
- Check parameters: Verify the AI passed correct values
- Review errors: Read error messages for specific issues
- Test fixes: Adjust tool schema and retry
Iterating on Tool Schemas
If the AI consistently misuses a tool:
- Review the description: Is it clear what the tool does?
- Check parameter names: Are they intuitive?
- Add examples: Include example values in descriptions
- Reduce ambiguity: Make tool purposes distinct
If the AI keeps using the wrong tool, the issue is usually in the tool descriptions. Make sure each tool has a unique, clear description of its purpose and when to use it.
Best Practices
Start Simple
Test each tool individually before combining them in complex workflows.Test Edge Cases
Try empty inputs, special characters, and boundary values to ensure robust handling.Use Multiple Models
Test with different AI models to ensure tools work well across platforms.Check Execution Logs
Always expand execution details to verify parameters and responses are correct.Limit Active Tools
Enable only the tools you're testing to reduce AI confusion and improve accuracy.Document Issues
Use the History tab to track what worked and what didn't for future reference.From Playground to Production
Once your tools work correctly in the Playground:
1. Verify All Test Cases Pass
Ensure you've tested:
- Normal operations (happy path)
- Edge cases and error handling
- Multi-tool workflows
- Different AI models
2. Review Tool Schemas
Based on Playground testing, refine:
- Tool descriptions for clarity
- Parameter descriptions and examples
- Required vs optional fields
- Default values
3. Deploy to Agents
Add your validated MCP server tools to production agents:
- Go to Agent Builder
- Add the MCP server as a tool source
- Enable specific tools for the agent
- Test the agent with real users
4. Monitor in Production
After deployment, monitor tool usage in the MCP Hub dashboard:
- Success/error rates
- Response times
- Most-used tools
- Common errors
Next Steps
MCP Hub
Configure MCP servers and toolsConnected Apps
Connect apps to create MCP serversBuilding Agents
Deploy tools in production agentsAuth Configs
Manage tool authenticationSummary
The Agent Playground is your testing ground for MCP tools:
- Interactive Chat Interface: Test tools with natural language prompts
- MCP Server Selection: Choose which connected app's tools to test
- Tool Management: Enable/disable specific tools for focused testing
- Multi-Model Support: Test with GPT-4o, Claude, and other models
- Full Execution Visibility: Monitor every step of tool execution with detailed logs
- Chat & Form Modes: Natural language or structured parameter testing
- Debugging Tools: Identify and fix issues before production deployment
Use the Playground to validate your MCP tools work correctly, then confidently deploy them to your production AI agents.