Debugging and Testing
Learn how to use FlowGenX's traceability features to effectively debug and test your workflows during development.
Overview
Debugging and testing workflows is an essential part of the development process. FlowGenX provides powerful traceability and monitoring tools that help you test your workflows, identify issues, and understand exactly how your workflows execute.
This guide shows you how to leverage the Workflow Tracing & Monitoring features during development to:
- Test workflow logic before deployment
- Debug failed or problematic executions
- Verify data flows correctly through each step
- Identify and fix errors quickly
- Validate workflow behavior with different inputs
The traceability features described here are the same tools used in production. Learning to use them during development will make you more effective at debugging production issues later.
Testing Your Workflow
Running Test Executions
When developing a workflow, you'll need to test it multiple times with different inputs:
-
Trigger Your Workflow Manually
- Use the test or run button in the workflow editor
- Provide sample input data that represents real-world scenarios
- Execute the workflow and watch it run
-
Navigate to Workflow Runs
- Go to the Event Driven Workflows section from Flow Management
- Your test execution will appear at the top of the list
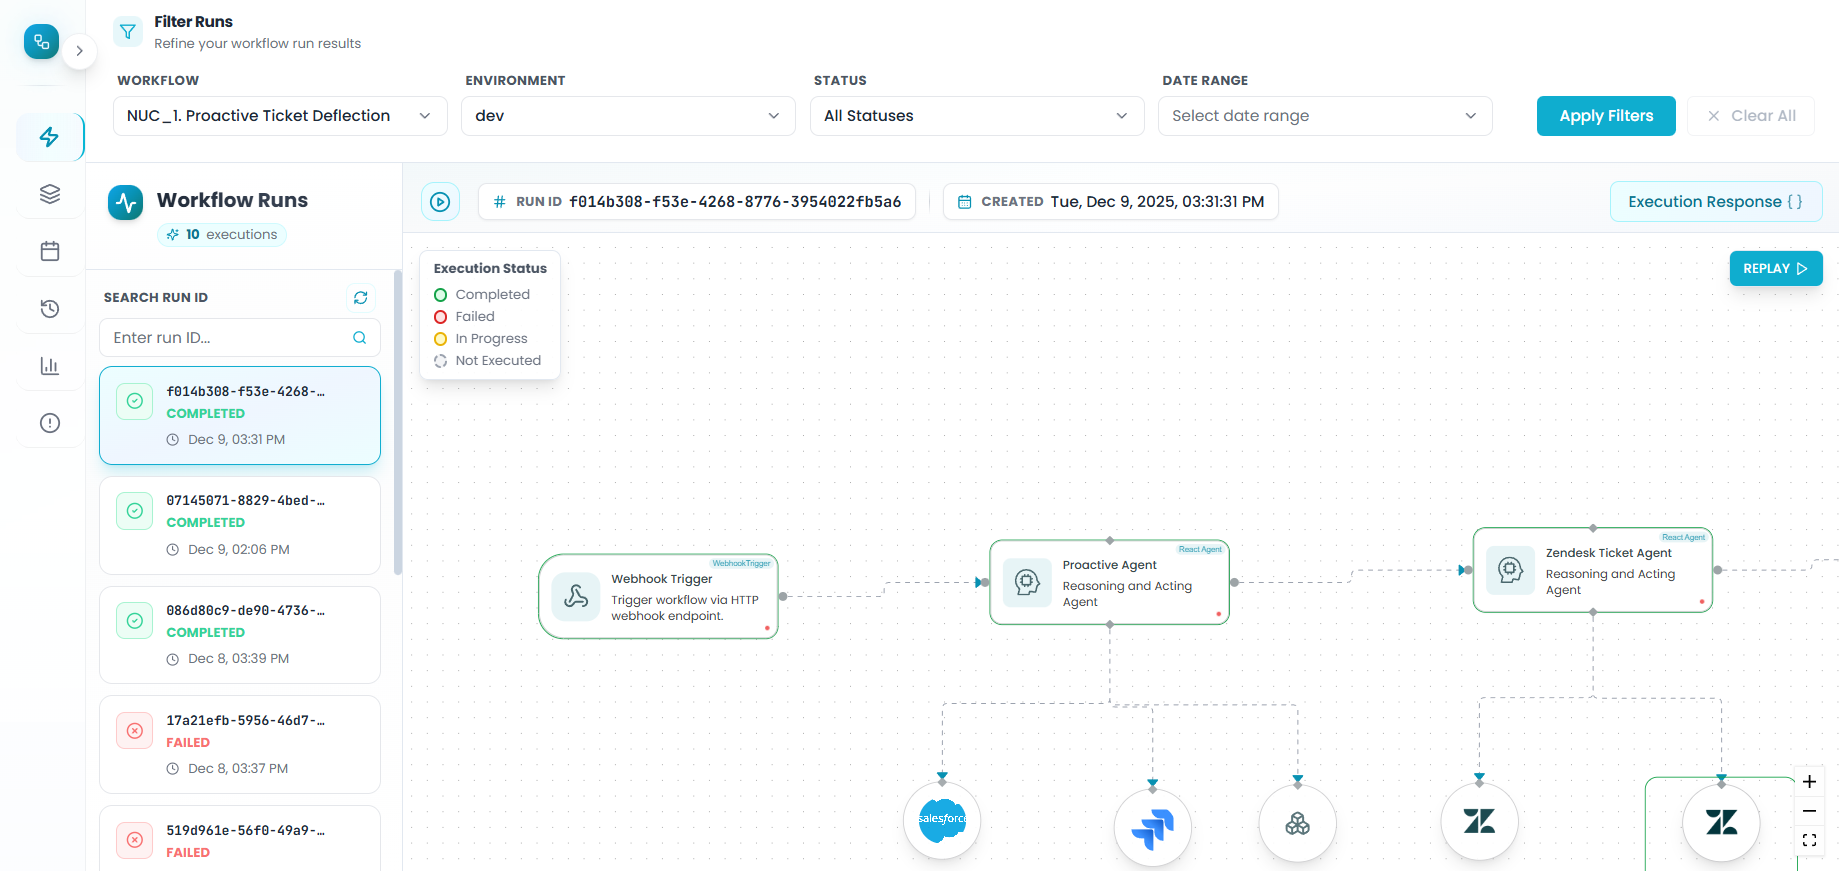
Each test run displays:
- Run ID: Unique identifier for this execution
- Workflow name: The workflow you're testing
- Timestamp: When the test was executed
- Status: Whether it succeeded or failed
Opening Your Test Run
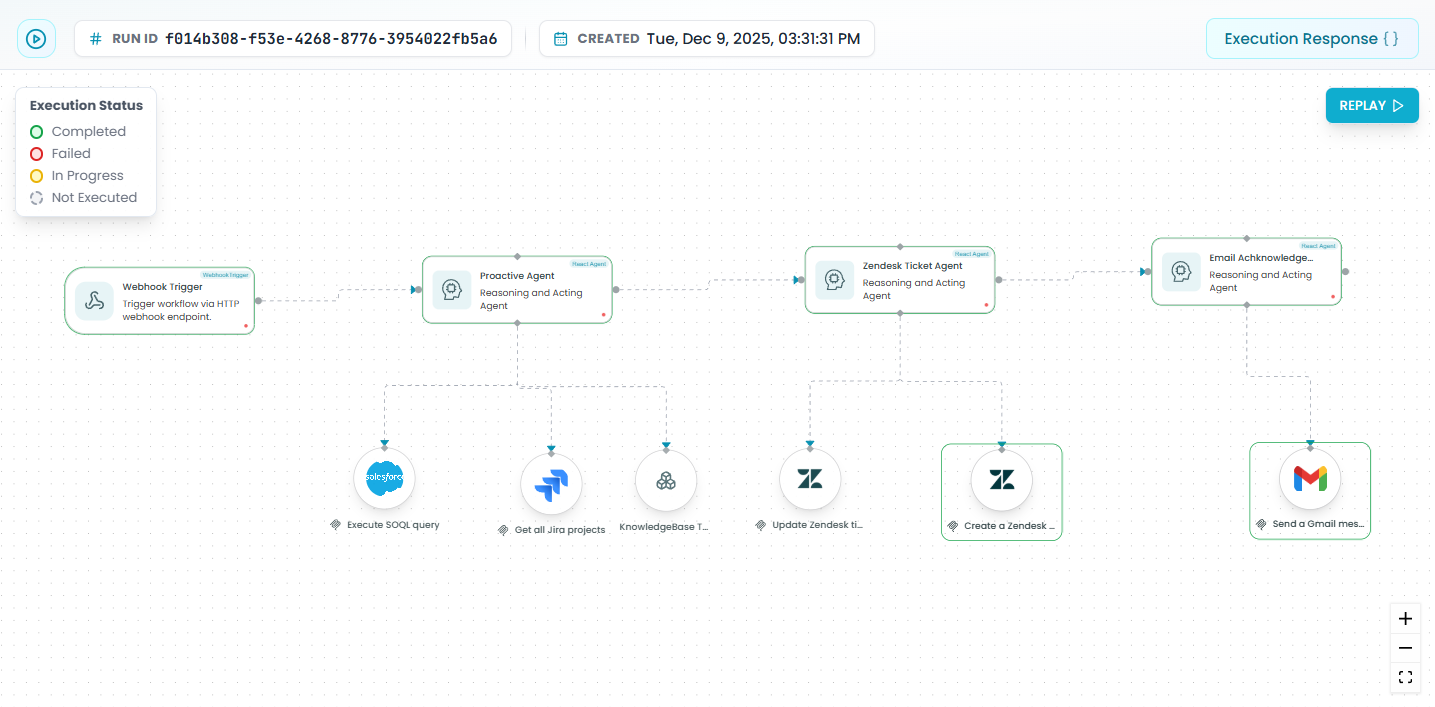
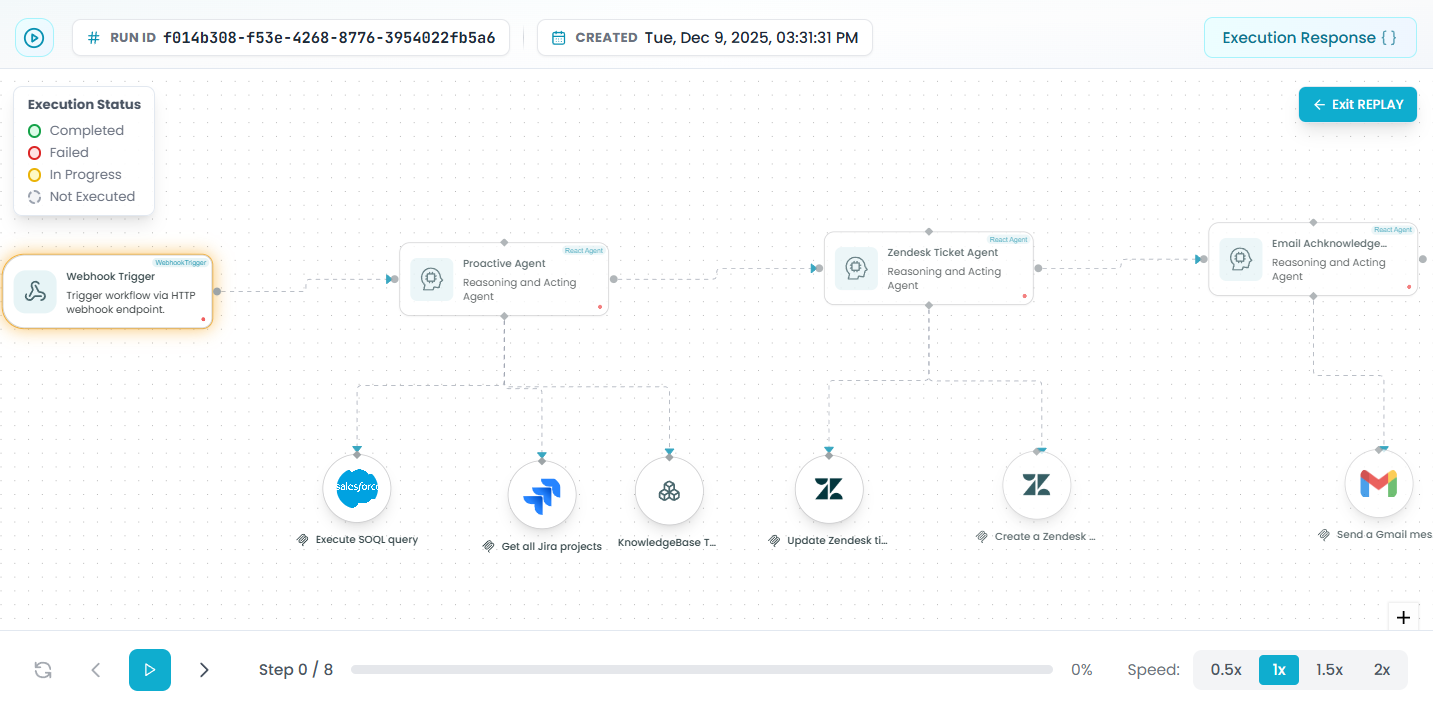
Click on your test run's Run ID to open the detailed execution view:
- Visual workflow representation: See your entire workflow structure
- Status indicators: Each step shows its execution status
- Trigger information: View what initiated the workflow
- Action sequence: See all steps in the order they executed
This visual representation is your primary debugging tool during development.
Understanding Execution Status
Status Types During Testing
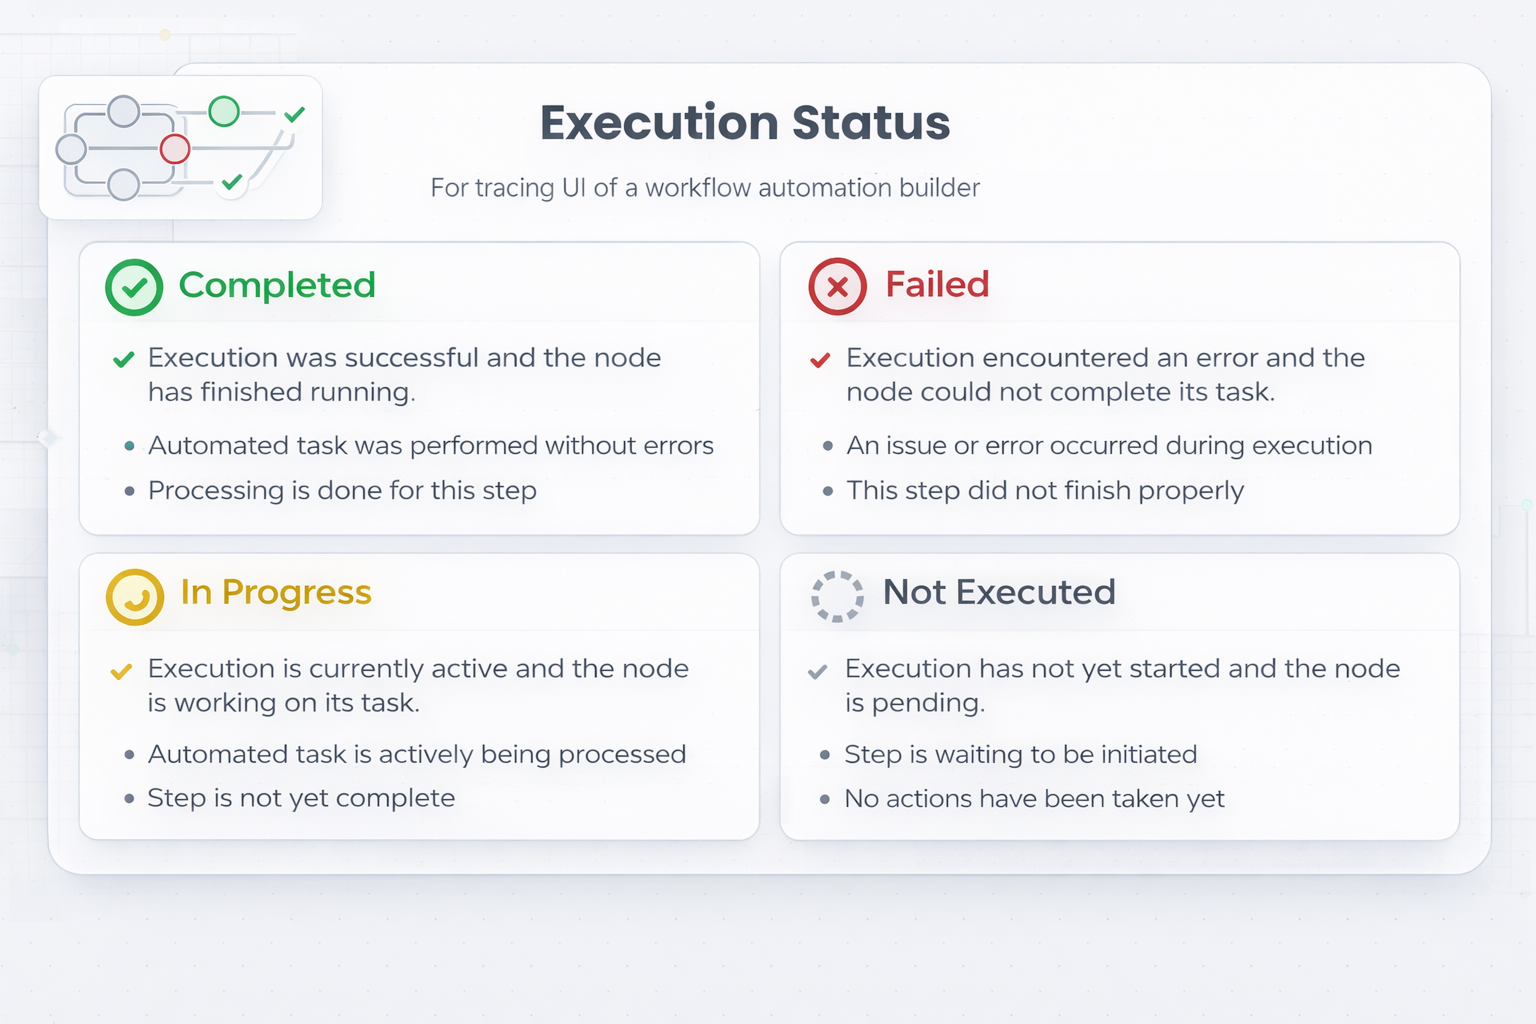
Each step in your test run shows one of these statuses:
-
Completed ✓ - The step executed successfully
- Use this to verify: The step processed data correctly
- During testing: Check the output to ensure it matches expectations
-
Failed ✗ - The step encountered an error
- Use this to debug: Identify which step is causing problems
- During testing: Fix the error and run another test
-
In Progress ⟳ - The step is currently executing
- During testing: You'll see this in real-time as your workflow runs
-
Pending ⏸ - The step is waiting to execute
- During testing: Steps appear pending before they start
-
Not Executed ○ - The step was skipped by workflow logic
- Use this to verify: Conditional logic is working correctly
- During testing: Confirm the right branches are being taken
Using Status for Quick Debugging
Green path = Success: If all steps show "Completed", your workflow logic is sound for this test case
Red step = Debug here: If a step shows "Failed", start your debugging investigation there
Gray steps after red = Cascade: Steps after a failure show "Not Executed" - fix the failed step first
Inspecting Step Details for Debugging
Accessing Step Information
During debugging, you need to see what's happening inside each step:
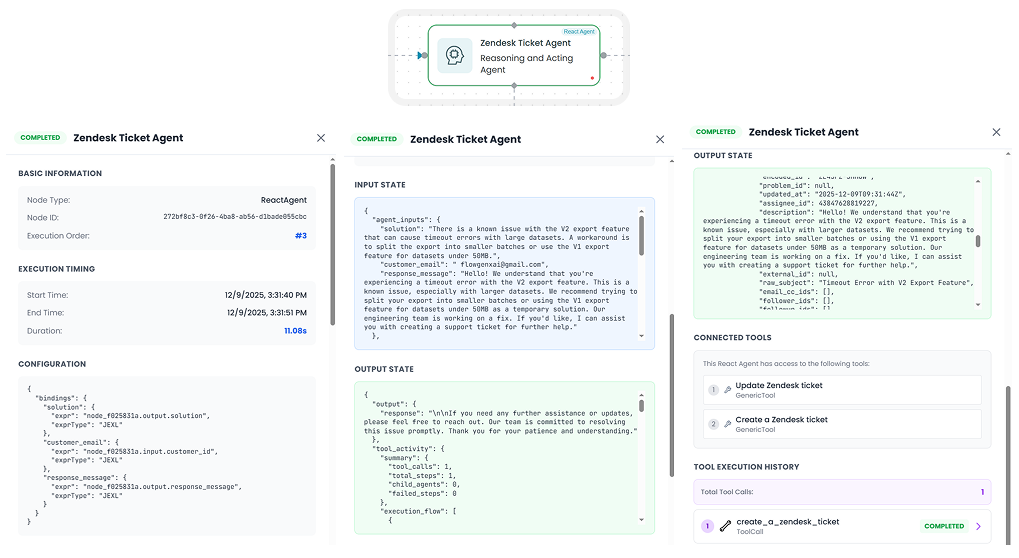
- Click on any step in the workflow visualization
- A detailed panel opens with comprehensive information
What to Check in Each Step
Input Data
When to check: When a step fails or produces unexpected results
What to look for:
- Are all required fields present?
- Are the data types correct (string vs number)?
- Does the data structure match what the step expects?
- Are there any null or undefined values?
Debug Example: If a step expects user.email but receives user.emailAddress, you'll see this in the input data and know to fix the data mapping.
Output Data
When to check: When the next step fails or when verifying workflow logic
What to look for:
- Does the output match what you expected?
- Is the data being transformed correctly?
- Are calculated values accurate?
- Is the output structure correct for the next step?
Debug Example: If you're calculating a total but the output shows "100" (string) instead of 100 (number), you'll catch the type conversion issue.
Error Messages
When to check: When a step shows "Failed" status
What to look for:
- The specific error message and code
- Stack traces if available
- Which operation within the step failed
- API error responses from external services
Debug Example: Error message "API rate limit exceeded" tells you to add retry logic or slow down your requests.
Execution Metadata
When to check: When debugging performance or timing issues
What to look for:
- How long did the step take?
- Did it timeout?
- How many retry attempts occurred?
- Resource usage patterns
Debug Example: If a step took 30 seconds but should be instant, check if it's making unnecessary API calls.
Using Workflow Replay for Debugging
The Workflow Replay feature is one of the most powerful debugging tools available. It lets you "replay" your test execution step-by-step to understand exactly what happened.
Entering Replay Mode
After running a test:
- Open the test run from the Workflow Runs list
- Click "Replay or Exit REPLAY" in the top-right corner
- The replay controls appear at the bottom of the screen
Debugging with Manual Step-Through
Best for: Understanding complex data transformations or finding exactly where things go wrong
How to use:
- Click the left arrow (←) to go back a step
- Click the right arrow (→) to advance one step forward
- Click on each step as you advance to inspect its data
Debugging workflow:
- Start at the beginning: Reset to step 0
- Advance one step: Click → to execute the first step
- Inspect the output: Click the step to see what data it produced
- Move to next step: Click → again
- Check the input: See if the next step received the correct data
- Repeat: Continue until you find where the data becomes incorrect
Example debugging scenario:
Step 1 output: { name: "John", age: "25" }  ← Age is a string (wrong!)
Step 2 expects: { name: string, age: number }  ← This will fail
You can now see exactly where the type conversion needs to happen.
Debugging with Automatic Playback
Best for: Understanding execution flow, timing issues, and conditional logic
How to use:
- Click the play button (▶) to start automatic replay
- Watch your workflow execute step-by-step
- Pause at any time to inspect a specific step
Speed controls for different debugging needs:
-
0.5x speed: Use when debugging complex logic
- See each step execute slowly
- Gives you time to observe status changes
- Perfect for understanding conditional branches
-
1x speed: Normal playback
- Watch the natural flow of execution
- Good for general understanding
-
1.5x - 2x speed: Fast overview
- Quick review of long workflows
- Verify overall structure
- Compare multiple test runs quickly
Practical Debugging Scenarios with Replay
Scenario 1: Debugging Conditional Logic
Problem: Your workflow is taking the wrong branch in a condition
Solution using Replay:
- Start replay at slow speed (0.5x)
- Watch as the condition step executes
- Click on the condition step to see the values being compared
- Observe which branch activates
- Compare the input data with your condition logic
- Identify why the condition evaluated incorrectly
Scenario 2: Finding Data Transformation Issues
Problem: Data is correct at the start but wrong at the end
Solution using Replay:
- Use manual step-through mode
- Start from step 0 and verify the initial data
- Advance one step at a time
- After each step, click on it and check the output
- The moment you see incorrect data, you've found the problematic step
- Fix that step's transformation logic
Scenario 3: Understanding Timing and Sequencing
Problem: Steps seem to execute in the wrong order or at wrong times
Solution using Replay:
- Use automatic playback at 1x speed
- Watch the exact sequence of execution
- Note the timing between steps
- Identify if asynchronous operations are causing issues
- Check if steps are waiting for dependencies correctly
Scenario 4: Comparing Successful vs Failed Test Runs
Problem: A workflow works sometimes but fails other times
Solution using Replay:
- Open a successful test run and replay it
- Note the data flow and execution path
- Open a failed test run in another window
- Replay both side-by-side at slow speed
- Identify where the execution diverges
- Compare the input data differences that cause different behavior
Best Practices for Debugging with Replay
- Always start with slow speed (0.5x) when debugging a new issue
- Use manual step-through for data flow issues
- Use automatic playback to understand execution order
- Combine with step inspection - pause and click steps during replay
- Replay multiple times - sometimes you catch things on the second viewing
- Take notes as you replay - document what you observe
Testing with Multiple Scenarios
Using Different Test Cases
During development, test your workflow with various inputs:
-
Run test with valid data - Verify happy path works
-
Check Workflow Runs - Find your test execution
-
Open and inspect - Verify all steps completed successfully
-
Run test with invalid data - Test error handling
-
Check Workflow Runs - Find the failed execution
-
Open and debug - See which step caught the error
-
Run test with edge cases - Test boundary conditions
-
Compare all runs - Use filters to see all your test executions
Filtering Your Test Runs
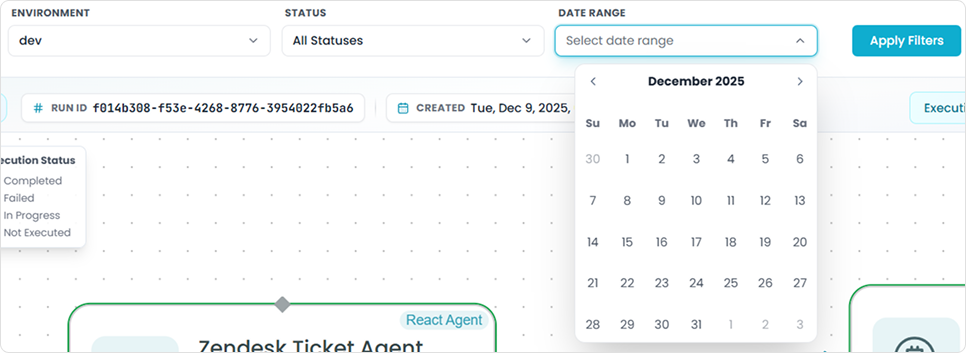
As you run multiple tests, use filters to organize your test runs:
Filter by Status - Find Failed Tests Quickly
Use during testing to:
- Filter by "Failed" status to see only problematic runs
- Filter by "Completed" to review successful tests
- Compare failed vs successful executions
Testing workflow:
- Run 5-10 tests with different inputs
- Filter by "Failed" status
- Debug each failed run
- Fix the issues
- Re-run and verify success
Filter by Date Range - Find Recent Tests
Use during testing to:
- See only today's test runs
- Review tests from a specific development session
- Track progress over time
Example: "Show me all tests I ran this morning"
Filter by Workflow - Focus on One Workflow
Use during testing to:
- Isolate tests for the workflow you're developing
- Avoid confusion when testing multiple workflows
- See the evolution of a single workflow
Combining Filters for Targeted Debugging
Example 1: "My failed tests from today"
- Filter: This workflow + Failed status + Today
Example 2: "Compare this week's tests"
- Filter: This workflow + Last 7 days
Example 3: "All successful tests to establish baseline"
- Filter: This workflow + Completed status
Systematic Debugging Process
When you encounter an issue during testing, follow this process:
Step 1: Reproduce the Issue
- Run the workflow again with the same input
- Verify it fails consistently
- Note the exact error or unexpected behavior
Step 2: Locate the Problem Step
- Open the failed run from Workflow Runs
- Look at the visual workflow
- Identify the first failed step (red status)
- Note any steps that didn't execute (gray status)
Step 3: Inspect the Failed Step
- Click on the failed step
- Read the error message in detail
- Check the input data - was it valid?
- Check the configuration - is the step set up correctly?
Step 4: Trace Back Through the Workflow
- Use Replay mode to step through from the beginning
- Verify data at each step leading up to the failure
- Identify where the data becomes incorrect
- Check if the problem is in a previous step
Step 5: Fix and Re-test
- Make the fix in your workflow editor
- Run another test with the same input
- Open the new test run
- Verify the step now succeeds
- Check downstream steps to ensure the fix didn't break anything else
Step 6: Test Edge Cases
- Run tests with different inputs
- Verify your fix handles all scenarios
- Use filters to compare all your test runs
- Ensure no regressions - previous successful cases still work
Common Debugging Scenarios
Scenario: Step Fails with Error Message
What you see: Red failed status on a step
Debugging steps:
- Click on the failed step
- Read the error message
- Check the input data for issues
- Verify the step configuration
- Fix the issue and re-test
Common causes:
- Missing required fields in input data
- Wrong data type (string vs number)
- Invalid API credentials
- Malformed request payload
Scenario: Workflow Takes Wrong Branch
What you see: Conditional logic goes down unexpected path
Debugging steps:
- Open the test run
- Click on the condition step
- Review the input data being evaluated
- Check the condition logic
- Use Replay to watch the condition evaluate
- Adjust condition logic or fix input data
Common causes:
- Case sensitivity issues (e.g., "Yes" vs "yes")
- Type mismatches (string "1" vs number 1)
- Null or undefined values
- Incorrect comparison operators
Scenario: Data Transforms Incorrectly
What you see: Output data doesn't match expectations
Debugging steps:
- Use Replay with manual step-through
- Start at the trigger and verify initial data
- Advance step-by-step
- Check output after each transformation
- Find the exact step where data becomes wrong
- Fix the transformation logic
Common causes:
- Incorrect field mapping
- Missing data transformation step
- Array vs object confusion
- String concatenation vs arithmetic
Scenario: Steps Not Executing
What you see: Some steps show "Not Executed" status
Debugging steps:
- Use Replay to watch the execution flow
- Identify which conditional logic skipped the steps
- Click on the condition to see why it evaluated that way
- Verify if this is intentional or a bug
- Adjust conditions or workflow structure
Common causes:
- Condition logic is too restrictive
- Wrong condition type (AND vs OR)
- Missing else branch
- Intentional skip (not a bug)
Testing Best Practices
Create Test Cases Before Development
- Define expected inputs for different scenarios
- Document expected outputs for each input
- Identify edge cases to test
- List error conditions to validate
Test Incrementally During Development
- Build one step at a time
- Test after each step is added
- Use Workflow Runs to verify each addition works
- Don't wait until the workflow is complete
Keep Test Runs Organized
- Use consistent test data naming
- Run tests in a dedicated test environment
- Use date filters to group test sessions
- Document test results as you go
Compare Before and After Changes
- Run tests before making changes (baseline)
- Make your changes
- Run the same tests again
- Use filters to compare old vs new runs
- Use Replay to compare execution differences
From Testing to Production
Once your workflow passes all tests:
Final Validation
- Review all test runs - ensure consistent success
- Test with production-like data - use realistic volumes
- Verify error handling - confirm failures are handled gracefully
- Check performance - review execution times in metadata
Deployment
When you're ready to deploy:
- Deploy to production environment
- Monitor the first few runs using the same Workflow Runs interface
- Be ready to rollback if issues appear
Continued Monitoring
After deployment, the same tools you used for testing become production monitoring tools:
- Workflow Runs shows production executions
- Step inspection helps debug production issues
- Replay helps understand production failures
- Filters help track production metrics
See the Workflow Tracing & Monitoring guide for best practices on production monitoring.
Summary
The FlowGenX traceability features are your primary debugging and testing tools:
For Testing:
- Run test executions and review them in Workflow Runs
- Verify each step executed correctly
- Test multiple scenarios and use filters to organize
For Debugging:
- Inspect failed steps to see error messages
- Review input/output data to find data issues
- Use Replay to step through executions
- Compare successful and failed runs
For Development:
- Test incrementally as you build
- Debug issues immediately when they appear
- Validate with multiple test cases before deployment
By mastering these traceability tools during development, you'll build more reliable workflows and be better equipped to handle production issues when they arise.